

This is our first Speedwell Research piece. We hope you enjoy it! Please email us at info@speedwellresearch.com for any questions, concerns, or comments. See our full disclaimer on our website.

Introduction.
Founding History.
An intimately private man, not much is known about the early life of Mark Leonard. As far as the internet is concerned, he first appeared in life when he attended University of Guelph in Ontario sometime in the early 1970s. Without much financial support, he worked a motley crew of jobs to support himself through college, including as a grave digger, a municipal park ranger, a bouncer, a furniture mover, a windmill researcher, a warehouse employee and a mason helper. Despite long hours that were labor intensive, he would shield his spare time to self-study and read various literature. Having to work to put himself through college, it took him 7 years of juggling demanding jobs and part-time classes to get his bachelor’s degree. After undergrad, he continued with a grab bag of jobs in order to continue his studies with an MBA at The University of Western Ontario’s Ivey Business School. At graduation, he had a job lined up as a banker. Even though it provided higher pay and better job security, it was a continuation of the pattern of taking jobs out of necessity rather than following some sort of grand plan. That would soon change.
He figured out the summer before, when interning, that he wouldn’t want to be a banker for long—a superior had actually told him that—and he was advised to go through the bank’s client list and see whose business looked the most interesting. With an attraction to learning technical fields and helping build something enduring, he was drawn to venture capital. After blanketing every Canadian VC firm with his application, he was swiftly rejected by each. Not deterred, he spent the little money he and his wife had to fly to VC conferences to network and better angle himself for a job. Eventually it worked, and he joined Ventures West, a leading VC firm in Canada.

Over the next 11 years in VC, Mark Leonard would solidify what he wanted to build. He would fondly recall how fulfilling it was to build something properly as a masonry, which required mastery and would be there 100 years later. (To his surprise, this was in contrast to many of the start-ups he worked with that had a “build to sell” mentality). His masonry experience, coupled with some mentorship that that exposed him to the Buffett & Munger orthodoxy, inspired his plan to construct an enduring company. This nebulous desire, however, only started to calcify after a novel insight about the success of Venture Wests’ portfolio companies. He noticed that their most successful venture investments were vertical market software companies, which to Leonard seemed to have all of the business virtues Buffett would want with a competitive “moat”. The problem though, was that each vertical market software (VMS) company was relatively unimpactful to the overall portfolio results because of their small size. His idea was to create a holding company that would just focus just on acquiring VMS companies, which he imaginatively wanted to call Software Co.

Mark’s reputation as a sharp thinker with an indisputable work ethic made many of his Venture West colleagues enthusiastic to seed his idea, which, alongside an old business school buddy who happened to work at OMERS (Ontario Municipal Employees Retirement System) pension fund, allowed him to raise a full $25mn CAD. There was one piece of feedback though; the name Leonard picked was terrible. And so Software Co. became Constellation Software, a reference to seeing a unifying picture of otherwise unconnected pieces, and officially launched in 1995.

Business History.
In the early years of Constellation Software, Mark Leonard would lead the acquisition process, focusing on wholly acquiring their first VMS companies. The attraction to VMS was born from the fact that each software offering tends to be mission critical to users and each market is small enough that competition is insulated from the big players who could not rationalize spending in these small TAMs. Additionally, the recurring nature of most revenues and minimal maintenance capex makes software inherently attractive (much more on this later).

Constellation closed their first acquisition in 1995 with Trapeze, a provider of fixed route scheduling software to North American public transit authorities. A year later, they acquired Harris Computer Systems, which focused on software solutions for the utilities industry. Leonard would have already been familiar with them as they were both actually Ventures West Portfolio companies. While details of their acquisitions are almost never disclosed, Mark Leonard did write a newsletter at the time called “Opportunity Above All”. They only published a few editions of the newsletter before axing it, ostensibly for competitive reasons, but there are some interesting insights in them. In the first edition, he remarked that a company growing revenues in the high-teens with low 20’s EBITDA margins was worth an average of 1.65x revenues before an “illiquidity discount” for private companies. He goes on to say that “We focus on buying companies that have a track record of double-digit growth and good profits. When we can find an industry leading firm with these characteristics and good management, we’ll pay up to 1.25 times revenues in cash. To the extent that these characteristics are missing we discount the price”.

Paying 1.25x revenues for a software company with positive cash flows may seem silly cheap, but keep in mind these are typically sub $5mn revenue companies that have growth prospects that are greatly constrained by their TAM and do not have natural buyers as private equity firms tend to only be focused on companies that are multiples of that size. (Having said that, valuations have considerably risen since this was written in 1998). Given that they are acquiring so many small companies, having multiple “capital allocators” who can find acquisition opportunities and deploy capital is critical, and actually at the heart of their success. (We will touch back on this in the next section).

A few years later, his friend who helped arrange the original OMERS investment left the pension fund, and a different analyst took responsibility to oversee the Constellation investment. Allegedly, the replacement and Mark didn’t get along as well, and the less congenial relationship spurred Constellation to add another large shareholder to counterbalance OMERS influence. This new investment came from TD Capital Canadian Private Equity Partners in the form of a $60mn private placement, which is what precipitated their IPO in 2006.

Unlike most IPOs, this public offering raised zero primary capital (funds that Constellation would receive) and was instead solely to provide early investors, namely TD Capital, a liquidity event. In fact, they never raised public equity capital and their shares outstanding has remained unchanged at ~21.2mn to this day. At IPO they had acquired 45 companies with $165mn in total revenue and a global footprint spanning 40 offices. Fast forward to today, Constellation generates in excess of $5bn annually with over 750 separate companies and their market cap has swollen from ~$275mn at IPO to ~$32bn; a ~120 bagger over a 16-year period which equates to an annual TSR of ~35%!

We will start our analysis with more details on their business.
Business.
Constellation Software themselves do not directly operate a business, but rather is the holding company that owns six VMS focused operating groups and is responsible for large capital allocation decisions as well as setting high level company policies. Each operating group in turn specializes within a handful of software verticals housing many distinct business units. Historically, the operating groups were some of their first acquisitions, which despite starting as small VMS companies themselves, grew to sizeable operations through dozens of acquisitions each that were conducted within an operating group.

In the spirit of how Mark Leonard conceived Constellation Software—looking at portfolio companies of Ventures West—he kept the same hands-off attitude towards Constellation’s businesses. Thus, the operating groups enjoy significant autonomy and can run their businesses however they see fit. Constellation considers autonomy essential to attract and retain high quality employees, especially the operating group heads who are regularly approached by private equity firms or other software roll ups. Additionally, since there are dozens to hundreds of business units housed inside a single operating group, decentralizing decision- making is critical to properly run all these different business lines—some of which may have just a few million in revenues, representing a fraction of 1% of Constellation’s overall revenues.

Constellation used to make the distinction between public and private end markets since their customers tended to have different spend cycles with the public sector more correlated to government budgets and the private sector more closely following the strength of the economy. Volaris, Harris, and TSS were historically counted in the “public sector” reporting segment, whereas Jonas, Perseus, and Vela were included in “private sector”. However, as early as 3Q13, Mark Leonard started conveying to analysts how the distinction between the two has been blurred, citing Trapeze—a business unit in the Volaris operating group which is categorized as public sector—increasingly moving into private sector businesses. Nevertheless, they continued to use public and private sector as reporting segments until 2020, when they abandoned the practice citing that the aim of each operating group is to deploy capital at or above the hurdle rate and not simply to own something that serves a specific end market. Before they collapsed the two reporting segments into one, they noted that 35% of the “public sector” revenues were served to commercial interests and 15% of the “private sector” revenues could be attributed to government customers. Adjusting for this difference, it comes out to a roughly 50/50 split between public and private sector customers by revenue. While they have collapsed the private and public reporting segments into one, they continue to break out 4 segments of revenue.

Constellation has four revenue segments: 1) Licenses, 2) Professional Services, 3) Hardware & Other, 4) Maintenance & other recurring revenue. Each revenue segment is presented on a consolidated basis across all 6 of their operating groups (including Topicus, which they only have a ~1/3rd interest in). As shown above, the largest by far is Maintenance revenue at >70%. The revenue segments are not mutually exclusive, and most businesses will collect from clients several streams of income. For instance, a company might charge a customer a perpetual software license with annual maintenance revenues equivalent to 20% of that amount. Then, if a customer requires customization or help setting up a system, CSI would book an additional stream of revenue in either the Professional Services segment or Hardware & Other. Each revenue segment is defined as follows:
1) Licenses: The software licensing fee is a charge for the use of the software, generally licensed under multi-year or perpetual agreements.
2) Maintenance & Other Recurring: These are fees charged for customer support on their software products “post-delivery” and also includes recurring fees derived from software as a service subscription (SaaS), combined software/ support contracts, and hosted products. These fees generally entitle a customer to product updates “when and if available”.
3) Professional Services: These are fees charged for implementation and integration of their services, customization programs, product training and consulting.
4) Hardware & Other: This includes the resale of 3rd party hardware as well as sales of custom hardware assembled internally on a customer’s behalf. They report this line net of the 3rd party hardware cost (similar to a gross profit) so there is less topline distortion.

It may seem weird “licensing” is essentially a right to use the software without necessarily buying the software, but it makes more sense if we think about the history of the software industry and how ERP systems have developed. (ERP or enterprise resource planning simply refers to an information system that integrates data within and across functional areas of an organization. This includes everything from accounting and HR to manufacturing production controls and global resource procurement). Before the advent of the internet and more capable computers, large businesses would need to buy their own servers in order to run their ERP systems. These servers would be housed “on-premises” (on-prem) for accessibility and speed, but that also meant that they were not easily accessible for 3rd party software providers or hardware technicians. A software provider would need to enter the company’s on-prem facilities in order to install the software, which would come from physical disks. Once the software was loaded onto a server though, the original software provider couldn’t directly monitor it nor could they disable it. With the software off the disk, it was out of the software companies’ hands and an unscrupulous business could use it outside of their terms of agreement. Since the ability to “turn-off” the software was technically infeasible, the idea of “licensing” the software was born in order to give the software company more control over their product after it leaves their hands—what the software company couldn’t do technically, they tried to do contractually. Thus, for many decades it was standard practice to charge for a license to use the software with separate fees for the software itself.
This model started to become usurped with the shift to SaaS (software-as-a-service) models, whereby the servers were now “off-premises” and the software was distributed via internet. The SaaS model recoupled the “right to use the software” with the actual possession of the software, a feat that was impossible when software was distributed via disk. This new distribution model meant that the control would go back to the software providers’ hands, as not only was it much harder to misuse their software when it was delivered by them, they also now had a technical solution to duplicitous activity—they could simply turn the software off. While software misuse from corporations wasn’t entirely common (and it is still true that there is a terms of service agreement with SaaS providers), we think this history better helps conceptualize the industry.

Before getting back to Constellation Software specifically, it is worth further exploring this difference between the traditional enterprise software model vs SaaS. With the traditional model, you receive very high margin, albeit lumpier, licensing revenue from selling the rights to use the software, as well as a decently lucrative stream of revenues from the upkeep of the software and updated versions. This maintenance stream of revenues is usually 20-25% the cost of the original license and can recur indefinitely. Additionally, any software customizations will be another source of revenue, although because of the development spend it is the least profitable. However, the software company benefits from customizing the customers’ software (beyond the direct profit) because it creates a stickier customer who becomes more reliant on the product. Creating further stickiness is the large upfront investment to originally set up the software, which would be re-incurred if they switch providers. Additionally, as replacing ERP software can be extremely disruptive to their business with dubious incremental benefit, the software provider really only has to provide adequate service to enjoy years of business. The lack of simple substitutions, large switching costs, and the value that (even mediocre) software provides is so high that customers seldom churn. So, in short, the software seller gets very lucrative licensing revenues and recurring maintenance revenues that are also quite profitable, with any desired customization paid for by the customer, which simultaneously makes the customer more attached to the product. Bringing it all together, this means software businesses enjoy a very high LTV for each customer, which reduces their need to continually attract new customers.

Now, the downside to the traditional enterprise model is that the costs are prohibitive for most businesses and the upkeep of on-prem servers is a hassle, requiring corporations to have their own in-house IT departments and putting the responsibility on them to have up-to-date hardware that can run the latest software. (As a side note, this is why Constellation sells a small amount of hardware—as a convenience for their customers who have on-prem systems). Furthermore, the upfront investment makes most potential customers hesitant to commit, even if the software offering has the potential to be hugely value-additive. As a result, until fairly recently, software systems were out of reach for most businesses. Enter SaaS.
SaaS has drastically increased the use cases for software, making it much more accessible and cheaper for many. However, we have to be careful parsing out what is a positive for consumers versus the software provider. With SaaS there are three main differences: 1) a different economic model, 2) a changed billing cycle, 3) new distribution means. First, the economic model changes from having multiple sources of revenue (licensing plus maintenance) to just one recurring fee. The loss of the licensing fee is made up in part with a slightly higher recurring fee and this largely nets out to being the same. Second, SaaS companies tend to bill monthly rather than annually. This may sound like a benign difference, but it actually makes SaaS considerably less attractive from a cash flow perspective versus traditional enterprise software where you get a full year’s revenue paid up front, in addition to the licensing fee. There is a slight offset to this though. Having monthly instead of annual agreements, coupled with distribution via internet instead of physical disk and on-prem servers, greatly increased the pool of potential customers since the upfront commitments were greatly lowered. (It should be noted that some SaaS has moved to an annual billing cycle, led by Salesforce in 2015, which helps SaaS companies enjoy an improved working capital dynamic).
SaaS brings some pros and cons. On one hand, you have lowered friction to start using the service since the software is delivered via internet versus needed to schedule an appointment and work with your IT department to set it up. But on the other hand, that also means you get less committed customers, and the switching costs are lower, leading to higher customer churn. Additionally, since the introduction of the public cloud, software creators can develop their programs on the likes of AWS, Azure, or GCP which lowers the barrier to entry for new software providers. With higher competitive intensity, lower customer loyalty, and worse working capital dynamics, it’s not a mystery why Mark Leonard met the introduction of SaaS with caution. (And this is before considering how high SaaS valuations encouraged wasteful competition to grow since they were valued on the basis of revenue multiples. I.e., investing $5 to grow a $1 of revenues isn’t so irrational if the market is valuing that $1 of revenue at 10x and you can sell your stake before the environment changes).

The net of how these two factors (expanded TAM from lower friction but less customer loyalty) shakes out, depends on whether the TAM for a particular software offering was previously overly restricted. For a company like Shopify that caters to a long tail of SMBs, making their product as easy to access as possible for users is a virtue—even if it means higher churn—and their model would never have worked with the higher frictions the traditional enterprise model brings. However, for software companies that do not have a large market, SaaS could reduce the barrier to compete without an offsetting increase in market size.
Constellation has companies that operate on the traditional enterprise software model and the SaaS model, with the former being far more common for them. They also own some companies that blur the boundaries between the distinction, serving software from their own data centers. Constellation would contend that while the traditional software enterprise model may be more attractive, they will serve their customer however the industry requires. However, Constellation is in a more nuanced position than the average legacy software provider given their persistent focus on servicing niches that are insulated from these developments.
Constellation focuses on Vertical Market Software, which is highly specific software solutions that are useful only to a relatively small number of customers. One example is Aeros LIVE, which helps flock owners manage their chicken hatcheries. Another is CompuMove, which supports movers with dispatch and scheduling. The mover and chicken hatchery markets are inherently limited, but in that comes several advantages.

When we think of the threat SaaS brings to the market, it essentially is that it loosens the customers attachment to any one provider and opens up the market to competition. However, the threat with SaaS is the lower distribution costs to serve the masses. But by definition, the vertical markets have a small number of customers, making such a distribution advantage mute. Additionally, many vertical solutions require working with customers for some customization, which would further conflict with a model that attempts to sell a uniform product en masse. In short, they continue to buy businesses that run the traditional enterprise model as well as the SaaS model and will transition businesses where it makes sense to. Owning companies that operate in niche industries has partly insulated them from industry-wide pressures and continues to give them a unique competitive position, which we detail in the next section.

Adding up the hundreds of VMS businesses that Constellation Software owns yields >$5bn in revenue in 2021 (~$5.7bn LTM), with maintenance revenues representing >70% of that. On average, they run around a ~25% EBITA margin, or just under 20% FCF margin, having generated $1.4bn in EBITA and ~$900mn in FCF in 2021. Acquisitions have totaled ~$1.2bn for 2021 and $1.7bn LTM.

VMS Moats.
VMS companies enjoy several competitive advantages:
1) Mission Critical. The software CSI’s businesses provide are by and large mission critical ERP solutions that are essential to a business running properly. Whether that be Trapeze’s public transportation scheduling software or Harris’s North Star customer billing system for utility companies, these are all software offerings that cannot be removed without replacements once adopted. Such reliance, stemming from being integral to basic day-to-day functions, means that elimination without a replacement is totally unfeasible.
2) Few substitutes. Replacement isn’t easy though as each vertical only tends to have a couple options, of which CSI’s businesses are almost always the #1 or #2 provider.
3) Small, fully served TAMs. The small TAMs become insulation for incumbent players as a newcomer cannot rationalize trying to break into the vertical, since it is already largely served. An early mover advantage isn’t usually thought of as a sustainable advantage, but it can turn into one if the market is small enough that you can totally server it before another player can enter and your customers are captive. For a competitor to rebuild an existing VMS business is far more expensive than it originally cost the early mover since it is a lot more expensive to convince customers to leave from a solution that is largely meeting their needs than try something new when they were using nothing.
4) Switching Costs. The switching costs make this especially true, with leaving a provider meaning a potential total disruption of business operations, which can directly lead to customer churn and lost sales. A new software system could also present issues that weren’t apparent to a business when they originally decided to switch, like integration issues with other software they utilize. A competitor’s product would have to be much better than the existing solution for a business to even fathom switching ERP software. Furthermore, overtime employees get used to existing solutions and changing it could require retraining all of their staff, as well as cost the company the lower productivity they will incur while they learn to use it. Thus, again a new entrant has to do far more to win a customer than the original software entrant did when their target customers weren’t served by any solution. 5) Small portion of total cost. The total software cost relative to the customer’s total cost base is usually very tiny (under <1%), coupled with its importance and stickiness means competitors will not have much luck competing on price.

So, in order for a new entrant to take an existing VMS business, you have to convince their customers that your solution is many-folds better than what they are currently using and that it is worth risking potentially secluding their customer and losing sales, as well as all the headaches that come with removing a foundational building block of a company’s systems that was relied on for decades, which include potentially working to re-integrate other software and retraining your entire employee base. Additionally, you’d have to cross your fingers that your competitor doesn’t simply say they can build the same thing, in which case the customer you are trying to poach will simply wait. Not to mention, if there are customizations the incumbent VMS company created for their customer, you will have to convince them you can rebuild those seamlessly and quickly, a shaky proposition given that the incumbent VMS’s developers likely worked directly with their employees for months (or years) to build out customized features—which is costly employee time they have no interest in spending again. Short of a new entrant being lucky enough that their competitors have been totally mediocre and inadequate for many years, there isn’t much hope of them taking business.

Other Business Virtues.
In addition to all of the attractive competitive dynamics, VMS businesses have several other attractive features.
1) Positive cash flow dynamics. While there is some variation here between the traditional enterprise model and SaaS, they often bill annually, getting a year’s worth of revenue in the first month. This greatly reduces payback periods on any customer acquisition and allows them to effectively use the customers own cash on any product upkeep.

2) Not Capital Intensive. As a software company there is no large capex outlay. We can think of some portion of S&M as “maintenance capex”, which is required for them to just keep their existing customers or replace lost customers. There technically is no “maintenance” R&D though as building new features and updates is usually used as rationale for price increases, so owing to the associated return this strictly speaking isn’t “maintenance” spend.
3) Consumer Surplus. The value of their software is so high that there is almost always a consumer surplus. CSI will continually raise prices to capture more of it, but they simultaneously “replenish” the surplus through new product addition and updates.
4) Recuring Revenues. Given the nature of their software, it is always running, and they get paid on a regular, recurring basis as a result. You can’t turn it off without a replacement, which is unlikely for all of the reasons we noted above.
Importantly though, Constellation’s competitive advantages as a holding company and buyer of VMS businesses are distinct from the businesses themselves. The VMS businesses clearly have strong competitive positions, but Constellation’s advantages are more tenuous.
Hold Co. Philosophy.
As mentioned prior, Constellation Software is very decentralized with each operating group running autonomously with full latitude to run their businesses as they see fit. When asked about Constellation’s philosophy on management, Mark Leonard often repeats a Buffett quip of “delegation to the point of abdication”. There are just a dozen employees at HQ for an organization with over 25,000 employees. Also similar to Buffett’s Berkshire Hathaway, such autonomy tends to attract talented employees and operators who highly value their independence and detest bureaucracy.

This level of autonomy is especially attractive to entrepreneurs who either 1) want a liquidity event, but also want to continue to run their business as they do currently, or 2) care about giving their business a permanent home where the new owner will not fire employees. This is partly why owner operators are Constellation’s largest source of acquisitions. The decentralization, though, also makes managing >750 companies feasible, whereas any degree of centralization would not only stymie innovation, but make it impossibly slow to respond to competitive developments or customer requests.

Mark Leonard is notoriously skeptical of top down “culture”, feeling that it seems rather authoritarian to insist on conforming values across their thousands of employees globally. He readily admits that most employees who work at a portfolio company would hardly know who he is nor care much about Constellation Software, and he prefers it that way. The culture that matters to Leonard is the culture that each individual business unit builds, no matter how different globally, and the loyalty employees have to each other and their small unit. Ironically, it’s his disdain for top-down culture that likely preserves it at the business unit level, as an acquired company often changes nothing material after being acquired.

There is a strong culture, however, of sharing best practices across different business units and operating groups. Helping support this practice of sharing lessons business units have learned is the fact that employees (depending on seniority) are forced to invest up to 75% of their cash bonuses in Constellation stock. Dictating an employee’s or an executive’s bonus is a formula that takes into account business unit (or operating group) ROIC and organic growth. Unlike other tech companies, there is no stock or options that are granted to employees and executives and shares outstanding have remained flat since the IPO. The forced purchase of stock is thought to create better employee buy-in because they are purchasing the shares themselves with their hard-earned cash rather than as an added perk. This practice has been going on since the early years of Constellation and in 2015 Leonard noted that CSI has created over 100 employee millionaires, a figure that must have increased significantly as the stock is up 5x since then. The result of this is material executive and employee ownership, beyond the ~7% stake that Leonard owns.
Such buy-in at the employee level is reciprocated by the company, who disproportionately prefers to promote internal candidates (84% of business unit leaders were internal promotes in 2016). Constellation allows for career growth for operators who sold their companies too, who may find themselves as a portfolio manager who now has responsibilities for a dozen companies and regularly diligences acquisitions. The mix of business operators and entrepreneurs who also are responsible for capital allocation is unique at Constellation and makes for both better investors and businessmen.
Every business unit has clear metrics they need to hit, of which ROIC and organic growth are the most important. By focusing on the factors that matter most to shareholders (versus something like market share) and continually measuring them, there is less risk of Constellation losing focus and turning into a political bureaucracy. Without the politicking that is common at many companies, managers are more free to explore their mistakes and learn from them—which they regularly do in post-acquisition reviews. The defined purpose clear metrics create allows managers and employees to move more cohesively across business units and gives them an unambiguous indicator to ground their day-to-day decision-making in. While Mark might be skeptical of imposing top-down culture, a culture at Constellation developed nevertheless. Their culture can be characterized as a trust-enabled decentralization, born from broadly presumed competence and a strong system of aligned incentives with feedback loops.
Despite the dedicated practice of decentralization, there is one important aspect though that is not left to managers to decide: what is considered acceptable capital allocation. In the next section, we will also see the limits of their structure and strong culture as a competitive advantage.
Capital Allocation.
We’ve talked a good amount about the VMS businesses themselves, but Constellation Software’s “business” is capital allocation, not selling software. Vertical Market Software just happens to be the place they feel the most confident investing capital in that meets their high hurdle rates, not just because of the competitive dynamics of VMS discussed above, but also because of their apparatus of support systems and best practices to run VMS companies that they have built out over several decades to protect the economics of acquired businesses. This, coupled with a large database on VMS acquisitions that informs them of fair acquisition assumptions, helps ensure they consistently meet their ROIC targets when they deploy capital. When allocating capital there are always risks, but those can be mitigated by staying solidly in your circle of competence (you at least know what you can’t know).

Thinking back to Mark Leonard’s first insight about VMS, the hiccup was being able to deploy enough capital into VMS, given that each opportunity each potential acquisition presented was inherently small. This meant Constellation would try to compensate for the small capital size of each transaction by doing a lot of transactions. At the very beginning, it was manageable for the “headquarters” to handle acquisitions, but as they grew, they would push down the capital allocation responsibilities into each operating group. Above you can see their early capital allocation framework whereby people in an operating group can recommend an acquisition, before they had the latitude to see it through. Acquisitions above $2mn needed Board approval (whereas today that limit has been increased to above $20mn). Still though, Constellation was laying the early groundwork for business unit managers to eventually take responsibility for capital by making them think as investors—a skill all too often absent from business managers.

The acquisition engine is aptly illustrated by Trapeze, their first acquisition, which also became their first operating group. The Trapeze operating group expanded beyond public transit into 5 other verticals. Each time they enter a new vertical they do a “platform acquisition”, which is their first acquisition in a vertical market that gives them a position to continue to grow in that specific industry. From there they may do further tuck-in acquisitions that relate to that vertical. The idea is that the managers of Trapeze are in a better position than headquarters to learn about companies in their industry, so having them help kickstart acquisitions greatly increases coverage of potential acquisitions.

The advantages Constellation Software has in acquiring VMS businesses is nowhere near as strong as the VMS businesses themselves. As Mark Leonard has noted before, the barriers to enter the business are a “telephone and a checkbook”. Nevertheless, Constellation has built up some advantages over time undergirded by their 1) reputation for decentralization which allows management to continue to run their company unencumbered, 2) quick andminimally disruptive acquisition process, 3) assurances that employees won’t be laid-off, 4) accommodating deal structures for tax peculiarities and earn-outs, 5) paying cash with no longer-term restrictions (they have never funded an acquisition with equity), 6) guarantee that the acquired company will remain in-tact for the long-term and not continually flipped , and 7) the potential for Constellation to help support further growth. These factors are particularly popular with owner operators, which compromise an estimated 70-80% of Constellation’s acquisitions. (Another estimated 10-20% of acquisitions come from corporate carve-outs).

Full liquidity events for owners of small VMS companies are relatively hard to come by. Most companies can never get to the scale where an IPO is feasible and even those that do are stuck holding most of their shares for fear of depressing the price and demotivating employees if they do dump it all. Most corporate M&A will have stipulations designed to keep current management in place with equity in the combined company that vests in tranches over several years to “align incentives”. Selling to private equity is probably the best option for most owner-operators who want to cash out, however most VMS companies are too small for PE funds to be interested. And if they are big enough to be acquired by private equity, they have to be okay with their “baby” possibly being stripped apart and bled for cash with potentially lifelong employees swiftly laid-off. For a long time, that left only Constellation Software as a natural buyer, which allowed them to conduct their early acquisitions at just 1.25x revenue (which was the upper limit!). More recently though, and largely because of Constellations success, copy-cat software aggregators have started to proliferate, who use Mark Leonard’s letters as their business plan. In fact, Constellation started becoming far quieter and Leonard stopped writing his annual letters all together in 2017, knowing he was just emboldening the competition.

Today, Constellation loses a lot of acquisitions to higher bidders because of their strict hurdle rate discipline and disdain for excessive uses of leverage (and any forms of short-term leverage). Competition has mostly come from other investment funds who are willing to accept a lower hurdle rate, use leverage, or have frothier assumptions. In 2016, Redknee Solutions had accepted an acquisition offer from Constellation, but once word got out that Constellation was buying them it got more attention and ESW Capital swooped in with a higher offer. Competition also comes from a slew of newer software roll-ups like Valsoft, who launched in 2015 and basically try to mimic the Constellation playbook. Older and more established software companies are competition too, like Tyler Technologies (focused specifically on serving government entities; stock ticker NYSE: TYL) and enChoice (broad digital transformation solutions) who merge acquired company’s products into their existing platforms.
Unlike these competitors though, Constellation will not factor in synergies or potential cross-selling opportunities into their purchase price. This is in part because of their emphasis on decentralization, but also because they feel factoring synergies into the purchase price can be risky. Having said that, some of our channel checks have expressed that on certain acquisitions they will consider cost reductions from common accounting functions or HR in the purchase price. The Volaris group seems to assume cost synergies most commonly in acquisitions, which is seen in passages from Volaris’s “Guide to Selling Your Software Company”. The below insert is taken from page 5 and mentions several benefits of selling your company for what are essentially synergies. This was corroborated by our channel checks which suggested their purchases used conservative “synergistic” assumptions. (The highlights below are ours). This could either be a newer development for Constellation or just an example of how each operating group has latitude to make their own decisions for sub $20mn acquisitions. We would view synergies as an advantage for Constellation to acquire businesses, so long as they are being conservative.

There are two other factors that help Constellation stand out versus the competition and that is their (1) acquisition database and (2) coverage list of over 50,000 companies. Constellation Software has completed over 750 acquisitions, which gives them a good sense of parameters for underwriting a value-accretive transaction. They will have a far better understanding then competitors on when assumptions are too rosy or conservative and what the unique challenges of certain verticals will be. The second factor is simply coverage. While Constellation has built out their list of potential acquisitions to over 50,000, as of 2020 Constellation wasn’t aware of 70% of companies that were sold in a given year. This implies that simply working to improve coverage would increase their opportunity to bid on companies 2-fold. Furthermore, it is estimated that Constellation acquires fewer than 3% of all software companies that are sold within a given year, showing how despite deploying ~$1bn on acquisitions for an estimated ~100 companies, there still is room to grow. This is partly why the rivalry between operating groups for acquisitions is mostly limited. Additionally, each operating group’s core verticals only moderately overlap. However, there is some “horse trading” if one group identifies a potential target first. In most cases, anyone who identifies a company first has 6 months to have “first dibs” on closing a deal, in which case it can go back up for grabs. Generally speaking though, some internal competition for acquisitions is desirable.

However, the future doesn’t look quite as bright as the past not only because of increased competition, but also because Constellation’s ever increasing cash flow means their acquisition spend has to go up commensurately. We will pick back up on this point later.
Looking back at the Trapeze diagram from the prospectus, you’ll see the other category noted is product initiatives, which in 2004 they started separating out from all of their other R&D and S&M spend. The idea being that in order to get a sense of what is the best use of capital, they would need to have a solid sense of returns for their initiatives. Most of their initiatives could take 5-7 years to reach cash flow break even, so they wanted to parse it out from other “maintenance expenses”. What Mark Leonard was figuring out early on, most investors wouldn’t catch on until much later, which is that software companies principally invest through their P&L instead of cash flow statement. This means that growth initiatives are bucketed in with other “maintenance” expenses and it conceals the underlying business’ economics. Furthermore, given the attractive cash flow dynamics of software companies, receiving cash up front for services rendered later means that investing cash flows in growth initiatives can appear to be loss making because these “investments” are fully expensed in the period and the return is delayed. (This is in contrast to capital expenditures whose P&L impact is limited to the deprecation or amortization, which by definition is expensed over its useful life, matching the expense to their revenue generation period). The result of all of this means that it is hard to know whether these P&L investments are indeed value accretive or if capital is better spent elsewhere. This question was at the center of several internal studies.
Just a year after they started tracking these investments, initiatives as a % of R&D + S&M and total R&D + S&M as a % of net revenue peaked. It seems that merely tracking their initiative spend resulted in better control of spending (a sort of observer effect). The resulting data indicated that their IRR on internal initiatives by and large couldn’t match what they generated on acquisitions and thus internal capital allocated to initiatives continued to be driven lower.

Business managers essentially have 3 options to decide between for their excess capital: 1) conduct an acquisition, 2) launch an internal growth initiative, or 3) send their capital back to HQ. Of course, it is easiest to get the highest returns if the amount of money you are deploying is smaller, which is what some operating units that were incentivized on ROIC figured out early on. They would deploy whatever capital they could without reaching for returns and then send the rest back to HQ. Noticing this, HQ experimented with a “Keep Your Capital” program for Vela and Volaris. The result was more capital deployed at attractive, but slightly lower rates of returns with higher organic growth. This makes us think of the internal initiatives as a sort of buffer to absorb capital, whereby if they do run low on the attractive M&A opportunities, they can direct more capital into internal initiatives at good, but relatively lower returns.
While it does seem that on occasion HQ can kickstart the M&A process, it is mostly the operating groups’ responsibility (who in turn partially push it down to the business units). This leaves HQ with essentially two decisions 1) buy back stock or 2) pay a dividend. Stock buybacks seem unlikely as Leonard has expressed disinterest, feeling that the company’s management always knows more than the shareholders and it is predatory. However, at a recent annual general meeting (AGM), he noted that several executives disagree, particularly if a stock repurchase program was disclosed well in advance. So, while they haven’t ever bought back stock before, that policy isn’t enshrined and that could change in the future.
In regard to dividends, Constellation has paid a small dividend since at least 2002 when it was private, but it has always been a small portion of free cash flow. It was raised to a more meaningful $1 per quarter in 2012 when there were fears that their PE owners, who felt Constellation was undervalued and struggled to sell their stake in the thinly traded market, would try to sell the company. The increased dividend (representing about 3-4% dividend yield at the time) was more a strategic decision to make their stock more marketable, rather than driven by strong capital allocation rationale. Shortly after that, the stock started to appreciate considerably and the PE owners that wanted out were able to sell without issue. However, Mark had felt a loyalty to the shareholders who bought the stock on the premise of on-going dividends as they helped save Constellation from a sale. As such, he never eliminated it, despite warning that he could. Fast forward to today though, that $1 per quarter dividend is fairly trivial, representing a dividend yield of just ~0.25%.
In 2019 though, Constellation felt their cash balances were too high (slated to reach above $850mn for the year) and they declared a $20 per share special dividend for a total of ~$420mn. While representing only around ~2.5% of the stock price at the time, its ramifications went far beyond its direct financial impact. As we will detail more below, the problem is that a significant portion of Constellation’s valuation is predicated on on-going success in finding high ROIC opportunities to deploy capital. Thus, dividends and buybacks would be an admittance that opportunities are drying up. However, over the past couple of years we have seen acquisitions exceed free cash flow, which is reassuring that Constellation may yet have a long runway to deploy capital at their attractive ROICs.
Hurdle Rates and ROIC.
We have referred above to Constellation’s internal “hurdle rate” they use for all investments, but while the exact number has never been disclosed, in 3Q11 Leonard noted that he is looking for 20%+ returns on incremental capital, which they have handily beat historically. The vast majority of capital has been allocated to acquisitions, so their conservatism in projections and being disciplined buyers is critical to preserving their high ROIC. Before making any acquisition they typically model 4 scenarios and then probability weight them to get cash flows that they then run an IRR calculation on. This will inform their max purchase price that will still allow them to meet their hurdle rate and they will never go back and tweak it to get a higher price. Constellation‘s data repository from past transactions allows them to know with good confidence what assumptions to use without getting anywhere near frothy. Disciplined and prudent acquisitions have led to a consistently strong ROIC overtime, as shown per Mark Leonard’s calculations below.
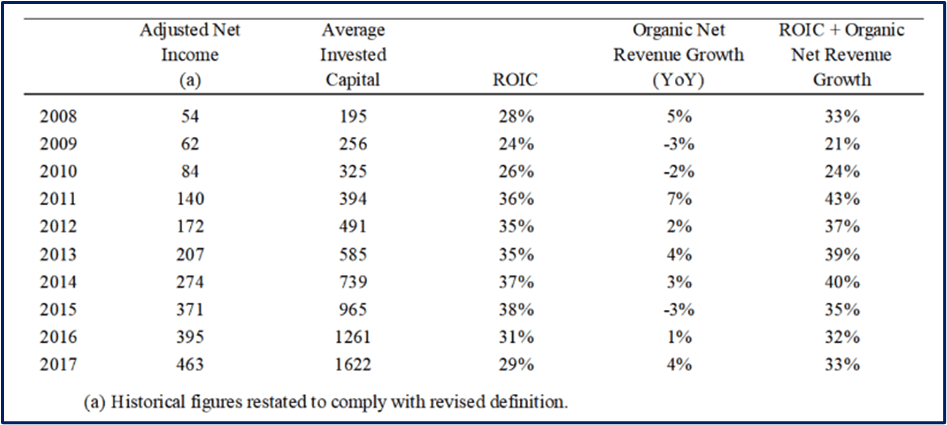
There are a few things to note from the exhibit above. The first is that his adjusted net income number adds back intangible asset amortization with the rationale being that the economic value of the intangible assets (which is mostly categorized as technology and customer assets resulting from acquisitions) do not deteriorate meaningfully in a given period. Furthermore, as Leonard notes, their appreciating intangible assets “more than offset any depreciation intangible assets”. There is no direct way for us to confirm that, but we see that maintenance revenue, in the table below, from new customers and price increases offsets annual churn of ~7% which is at least suggestive there is no material impairment. (You could argue that you should take an amortization expense roughly in line with churn and then capitalize a portion of R&D plus S&M to distinguish between growth and maintenance expenses, but it will shake out to roughly the same figure). In 2018, Leonard decided to move to a new metric that he calls Free cash flow available to shareholders (FCFA2S), noting that he feels more comfortable starting with an IFRS metric (cash from operating activities) and reducing the amount than starting with net income and adding to it. Usually, we would meet management adjusted figures with trepidation, but Leonard’s calculations are largely a fair representation of owner’s earnings. The one adjustment we would want to make, though, is adding back the revaluation change in the IRGA liability. We go into more detail as to the nature of this liability in the Topicus section, but essentially Constellation is obligated to buy a portion of Topicus at a price determined by the IRGA (Investor Rights and Governance Agreement) and the change in that price runs through the income statement. It is added back to get operating cash flow, but then Constellation backs it out again to get FCFA2S. They do this as it technically could be cash that Constellation will have to come up with at some point, and they adjust their NCI downward as if the transaction occurred. We would want to add the revaluation charge back because it isn’t a real recurring operating cost (ie they would only have to adjust the liability once to continue to enjoy the higher earnings that are associated with it). If we are backing out the revaluation charge though, we would also have to increase the NCI. Admittedly, this is all rather confusing and the ultimate impact won’t change the analysis, so for simplicity we have opted to just use the FCFA2S figure in our ROIC calculation below. If we had done this adjustment for 2021, then FCF would be about 10% higher. We do recalculate invested capital, though, at an amount higher than what Constellation shows (changes noted below).

Above is ROIC charted back to 2015 as we would calculate it. We use the same FCFA2S as published by Constellation in our numerator. For the denominator though we get different figures than what Leonard published in his letter. In both of our calculations we add back accumulated amortization of intangible assets since real capital was invested in these assets and because we don’t believe in taking the amortization in the numerator (FCFA2S adds back amortization of intangibles), it wouldn’t make sense to reduce the equity base by that amount. We also add current debt, lease obligations, and acquisition payables to our figure, as well as total equity instead of just retained earnings (it’s not clear to us why capital stock isn’t included in Constellation’s calculation). Either way, the ROIC figures we calculate average out to a very incredible ~26% over the past 7 years. This includes backing out cash, which if we didn’t, would drop ROIC by ~400bps (adjusting for the IRGA as noted above for 2021 would increase ROIC by ~200bps). While this may be lower than the headline ROIC Constellation has touted in the past, it is still a stellar record that very few companies can achieve, let alone sustain.
As Constellation pushes on growth though, ROIC tends to suffer. This goes back to our earlier discussion on software companies investing through their P&L with growth initiatives usually being paid out of R&D and S&M budgets. When they allocate to these growth initiatives, it depresses ROIC in the short-term because of the elevated expenses. To account for both of these, growth and ROIC, Mark Leonard likes to look at ROIC + Organic Growth. The logic behind this is similar to the Rule of 40 that is popular with software investors (your margin plus revenue growth should be above 40). As their investment cycle is slower than M&A (in 1Q07 they noted that a growth initiative generally has a 5-7 year payback period as it takes years to develop new products and then sell them to consumers), for many years capital has preferentially gone to buying companies. However, keeping organic growth as part of the equation (including in comp metrics) helps incentivize mangers to invest for the long-term. Mark Leonard has also made it clear that he much rather have another point of organic growth than of EBIT margin, which implies that ROIC would actually be higher if we stripped out all of these growth initiatives that are aggregated across the company.

Above we show organic growth by segment. The drop-off in “hardware & other” is not concerning, as that segment is mostly as a convenience to customers with small margins and only represents ~3% of revenues anyway. Licenses has also been lackluster, but only represents ~6% of revenues (albeit at very high margins). The Professional Services segment is ~20% of revenues, but it is more important than its direct financial impact. If you recall, this segment deals with all of the software customization, which requires Constellation employees spending a lot of one-on-one time with clients. Such a level of service not only helps Constellation’s VMS companies provide high quality service to customers, but also makes the relationship much stickier. This is a relatively lower margin business, but it effectively extends the lifetime of each customer and differentiates them further from the off the shelf types of software. This brings us lastly to maintenance revenues.
Constellation considers maintenance revenues as the best measure of business health and most important revenue stream owing to its recurring nature (whereas licensing, professional, and hardware is rather lumpy). Over time, maintenance revenues has grown to become a larger portion of revenues and has been a bright spot of their organic growth. Whereas their total organic growth has averaged 2% since 2016, maintenance revenue is ~4%. While these rates may not seem impressive in the scope of all software companies, remember it’s the IRR that matters, not the growth rate. A slowing (or shrinking) stream of income can still be very accretive if you didn’t pay a lot for it. With Constellation, you are not paying for growth per say, but rather their ability to deploy incremental capital at high a ROIC.
Below is a table that breaks out the different sources of maintenance revenue growth. It is important as one of the potential criticisms against Constellation is that like the typical cliché Private Equity firm, they buy dying assets and just wring them for cash to meet their hurdle rates. Such an argument might try to interpret their ~7% organic growth as the result of >100% price increases on the latest set of acquisitions, which are sufficiently high to hide the shrinkage in the rest of the businesses. This strategy wouldn’t exactly be problematic financially, if they were guaranteed to be able to find enough targets to keep it going. However, that is the problem: this approach would require ever increase numbers of companies to subsume to just maintain its existing size (owing to the short lifetime of the assets). This means every year they would have to acquire more companies and jack the prices up even higher just to offset the decline and earn the same as the prior year. To clarify, this criticism wouldn’t just be a concern that Constellation can’t grow, but also that their terminal value is too high as embarking on this strategy creates ever more impaired businesses. While admittedly, we have heard a few channel checks talk about certain acquisitions that were characterized by the “wringing for cash” strategy, the table below breaks down the components of maintenance revenue and disputes that this is Constellation’s main approach.

While it is true that ~7% churn is on the higher side for a typical software company, we can see that “new maintenance” growth usually meets or exceeds total attrition. Price increases do add a material contribution to growth, but they are not necessary to offset customer churn. This is suggestive that in aggregate, the VMS companies Constellation owns are not becoming impaired and in fact a little more valuable with each passing year.
Growth has become an increasing focus for Constellation though. Part of the impetus of their recent Topicus transaction (detailed later), was to learn more from Topicus on how they spawn high organic growth. Learning this skill would be great as it could potentially alleviate some of the pressure from the M&A teams to deploy growing amounts of capital. Another initiative, VMS Ventures, is designed to fund start-ups internally. Constellation has observed that certain business units would not be willing to make an investment in a product before they can be reasonable assured there is an acceptable ROIC. However, as is inherent in new products, such confidence can never be assured. Thus, good ideas are either forgotten or taken with departing employees for them to attempt them on their own. Now, with the $200mn Constellation put in VMS Ventures, these ideas can be funded internally, without the potential failure marring a business unit’s results. The hope is that this program can enable more risk taking and that the net result of it will be higher growth that is also value-accretive to CSI shareholders. An employee who wants to apply for the funding will lose their current unvested bonuses, but they can also make more if it is successfully, so there is an entrepreneur-like risk/reward.
What the future portends for Constellation’s hurdle rates is unknown, but it is clear it will be hard for them to reproduce the same returns as they did in the past again. Since Constellation announced its $20 special dividend, many investors have gotten louder at their capital allocation policy, which sets a hurdle rate ~1000bps above what an individual investor is likely to get elsewhere. Leonard would defend keeping their rates high, noting that “hurdle rates are magnetic”. His fear is that you cannot just lower your ROIC for incremental acquisitions, because whatever you set your rate at is the rate that every acquisition will fall to. So, if they lower their rates, more capital is deployed, but it is not so clear that the investor is better off. The middle ground that Leonard has arrived at is that they will lower their hurdle rate only on the large VMS acquisitions and keep them the same on the small and medium ones. He notes that 40-70 large VMS companies are sold each year, but Constellation has purchased fewer than 3 of them in their history. By lowering the hurdle rate only on large VMS acquisitions, the hope is that they can effectively maintain the ROIC for all other investments and only drop it on incremental capital, obviating the “hurdle rates are magnetic” conundrum. Just a year after Mark Leonard published this decision in his 2021 letter, they purchased assets from healthcare provider, Allscript’s for $700mn, over 100x the size of their average small VMS acquisition.

Lastly, Constellation has traditionally eschewed debt because they felt that the funding of a long-term asset should also be long-term. With the exception of a relatively small amount of debentures (that were covenant light with several advantaged characteristics like a PIK toggle), Constellation has had little debt for most of its history. At 2019 year end they had ~$500mn of debt with a 0.5x debt to equity ratio (>20x coverage ratio). Today, that is $1.8bn or just over a 1.1x debt to equity ratio (>15x coverage). By any measure, it is still a conservative amount of debt, and half of it isn’t even recourse to Constellation. But it seems we can expect the use of more leverage to help Constellation meet their ROIC thresholds, which is fine as long as it remains modest, and the covenants are well thought out (both of which we trust Leonard with given his several diatribes on early earnings calls on the issues with debt).

Above we see how their acquisition spend has been trending relative to FCFA2S. We can see that since 2020, acquisitions have exceeded 100% of FCF. Part of these could be the result a catch-up after Covid slowed down the typical cadence in 2020. However, with more larger acquisitions (Allscripts alone was over 80% of FCF) perhaps they can run near (or above with debt) 100% of FCF deployed on acquisitions. While this wouldn’t be our base assumption, it is an encouraging recent trend.
In addition to lower hurdle rates on large acquisitions and potentially more leverage, Constellation is also open to looking for return opportunities outside of their core VMS focus. In fact, Leonard surprisingly disclosed that they were far in diligencing a potential $1bn deal for oil assets before oil prices ripped back up. In addition to potentially expanding their investing universe, they could also do more spin-off transactions like TSS/Topicus.

Topicus.
The Topicus transaction was a concurrent spin-off of Constellation’s TSS operating group and merger with Topicus. TSS, or Total Specific Solutions, was originally created by the Strikwerda family office in Norway as a vertical market software roll-up focused on Europe. The European market is even more fragmented than elsewhere owing to greater linguistic dispersion and more onerous regulations. Many VMS companies would focus not only on a small niche, but had to focus within a single country as well. The upside to such small TAMs is that compared to their North American counterparts, their products can become even more wedged into a customer’s business. Constellation bought TSS in 2013, but as part of that purchase agreement the original owners (Strikwerda family office) retained a ~1/3rd stake.

Constellation liked the idea of the owners having more skin in the game and noted that such an arrangement could be used in the future. This is an example of a unique transaction that PE funds or other strategic acquirers may not be willing to contemplate, especially when coupled with the independence Constellation would grant them. It was an experiment in a way that worked out well overtime, with TSS growing significant under Constellation’s tutelage.
Topicus started in 1998 and while they also acquired many VMS companies, they worked equally hard to create their own VMS companies and software products internally. As a result, their organic growth historically was closer to low double digits, much higher than the low single digits experienced at TSS or Constellation. Part of the impetus for the transaction is a hope that Topicus’s success with organic growth can bleed through to the combined entity and possible throughout Constellation.

While the exact transaction structure and agreements are convoluted, at a high level, as of 2022, Constellation owns 30.4% of the combined entity and 1 super voting share that controls 50.1% of the votes. Topicus directly distributed to Constellation shareholders approximately 1.86 Topicus shares per Constellation share. Joday Group, which represents the Strikwerda family office, owns 30.3% of Topicus. However, the only way for the Joday Group to sell is directly to Constellation at a price that is dictated by the IRGA (Investors Rights and Governance Agreement). This option lasts until 2043 and creates distortions on the income statement and balance sheet, but it isn’t a real operating cost. It’s true that the liability represents a potential amount of money that Constellation will have to fork over, but it is a potential investment that if they are forced to perform on will confer to Constellation an at least equivalent value (in the form of an increased equity stake) as what they are paying out. The IRGA decides upon a price through a formula of different business fundamental metrics like maintenance revenue. Lastly, there is an 8.6% stake that is retained by the sellers of Topicus in a vehicle called Ijssel B.V.

Deal structure aside, this transaction allowed Constellation to take a stake in an asset that wouldn’t have been accessible otherwise. Additionally, the hope is that having a separately traded public stock better aligns employees and incentivizes them. A fear with forcing employees to purchase CSI stock is that the stock disappoints, which with it up 20x over the past decade seems like a higher risk. We suspect that part of the rationale for a separate publicly traded stock was to diversify this risk and give new employees a better chance of strong returns, which is just mathematically easier when starting off of a smaller base (Topicus’ market cap is ~1/6th of Constellations). Lastly, as mentioned prior, there is also some hope that Topicus’ organic growth practices can help seed other business units with best practices. Nevertheless, this transaction was a bit of an experiment. If it seems to achieve its aim, we may see more of them with other operating groups.
The combined Topicus will continue to operate as an operating group of Constellation’s, with three of their own operating groups underneath: 1) TSS Blue (focused on companies that sell to private businesses, 2) TSS Public (focused on government agencies and healthcare), and 3) the Topicus operating group. They will continue to focus on the European market, specifically in the Netherlands and Southern Europe. For the 6 months ending 2022, they have generated $424mn in revenue and $35mn of FCFA2S (down from $67mn in 1H21). They trade at a (fully diluted) market cap of ~$6.3bn under the stock symbol TOI in Canada (in CAD) and OTC in USD under TOITF. Let us know if there is interest in a future deep dive on Topicus.

Valuation.
We believe that giving a potential investor a single number for a valuation would not be that helpful as an investor doesn’t know what we are assuming and their judgement risk for return can differ. This especially varies based on the investors particular situation and whether they are investing under a stringent mandate. Ultimately, all investing comes down to a judgement on whether the return is adequate for the risk, and so we view our role here as helping best frame the discussion so the investor can decide for themselves (but that doesn’t mean we are unbiased, and our opinions may leak out quite loudly at points). Thus, in order to best equip an investor to make such a judgement, we find it most useful to lay out the critical assumptions implicit in paying a certain price.
For Constellation, we run our reverse DCF sensitizing for ROIC and % of FCF deployed. Constellation has a ~$32bn market cap or trades at 39x FCF (32x their 2020 FCF figure) and the idea is that an investor would only be willing to pay that because of the high rates of return that Constellation can earn on retained earnings. While of course this is true for all companies, there is no other better variable to sensitize for, so it is especially explicit here (for other companies you can sensitize for units, stores, or customers, etc.). These two sets of assumptions (% FCF deployed and ROIC) are used to inform Constellations cash flows, which we then discount. The reverse DCF solves for the discount rate needed to make the discounted sum of all cash flows equal to its current market price of ~$32bn or $1,500 per CNSFW (CNSFW is their unsponsored ADR that trades OTC in USD. CSU is their Toronto listed stock).

In order to make our assumptions more dynamic, rather then just assuming one ROIC and one % of FCF deployed figure for the full 40-year projection period, we adjust them based on the amount of FCF constellation generates and the amount they spend on acquisitions. Below is the table that shows our assumptions. Just looking at the top half of the table, the “Variable Set 1: % of FCF Deployed”, we see that there are three scenarios: 1) 50% FCF deployed, 2), 80% FCF deployed, and 3) 100% FCF deployed. For each scenario, the 50%, 80%, and 100% is in reference to the starting amount of FCF deployed and it drops based on how much FCF Constellation generates (that is the y-axis that starts with <$5bn). The idea is that as they generate more FCF, it will be harder to deploy it, so we drop the % deployed. If you look at the bottom half of the table, “Variable Set 2: ROIC”, the three scenarios are: A) 15%, B) 20%, and C) 25%. Again, these figures are in reference to the starting ROIC and it drops based off of the amount spent annually on acquisitions.

The amounts we model them spending on acquisitions may seem rather large, as they quickly compound already large figures. However, just in the past few years they have increased their total spend on acquisitions materially from ~$580mn in 2019 to $1.7bn LTM. The larger >$10bn acquisitions don’t show up in our models until over ~30 years (depending on ROIC and % FCF scenario). While this may seem unfeasible (and it could be), them finding new areas to deploy capital and accepting somewhat lower hurdle rates could materially open up their investment universe. Lastly, we can also think of this ROIC as really an ROE, with leverage helping them boost returns (but that would also imply that the amount spent on acquisitions is larger). Of course, an investor is free to only pay for whatever they feel comfortable with. We just are attempting to make explicit the assumptions that are implicit in the current valuation.
The assumptions mentioned above were then fed into our DCF, where we then solved for the discount rate that set the present value of cash flows equal to the current price. The table below lists the assumptions based off of the assumptions above, with the starting figures (what is highlighted above) shown on the x and y axis. Lastly, we ran the analysis twice, assuming 0 and 2% organic revenue growth. We assume the 2% revenue growth has a linear impact on free cash flow (i.e. incremental fcf margin is equal to current fcf margin), which may be conservative.

This analysis shows that within our parameters, an investor can expect to earn around 8-13% over the super long-term if these assumptions hold true (see risk section for caveats). We honed in on the 80-100% FCF deployed and 20-25% ROIC scenario as that is around what they are doing currently (Constellation actually deployed over 100% of FCF on average over the past few years). It is on an investor’s judgement to decide whether they believe this to be a fair return (Members Plus subscribers can download our excel model and adjust it however they wish).
By sheer coincidence, in one of Mark Leonard’s last letters in 2017, he stated “I have difficulty forecasting long-term growth in Constellation’s intrinsic value per share that exceeds 12% per annum”, the midpoint of our above estimates.
Before moving on to risks, below is a caveat in Mark’s words:

Risks.
1) Incremental Capital cannot be deployed at adequate ROICs. As mentioned prior, this is the key risk for Constellation. With the current valuation, investors need many years of high ROICs in order to make a good return. If Constellation cannot accretively deploy capital through acquisitions or internal initiatives they will return it back to shareholders, which will ensure a subpar return. Not having capital deployment opportunities can also lead to organizational brain drain as Constellation becomes a less engaging place to work and the best employees leave. As the best employees leave, Constellation’s productivity drops, which shows up in the financials in terms of higher expense ratios.
2) Constellation lowers hurdle rates again. The same way that CSI lowered hurdle rates for large acquisitions, perhaps they lower them again on all acquisitions. This decision could be compelled by shareholders who are willing to accept far lower returns and do not want capital returned. All CSI investors will suffer the lower returns though.
3) High stock price erodes comp system. As Constellation forces employees to buy stock at market level prices, a high stock price at an overstretched valuation will ensure that the employees do not make money on the stock (or lose money). In either case, employee morale will be lower and many will be resentful their employer forced their savings into a stock that lost them money. Constellation will either have to make up the difference with higher cash comp or employees may leave. All of this could not only raise expense ratios, but also hurt their acquisition engine.
4) More competition for acquisitions. Competition has always existed, but the more competent competitors with lower hurdle rates and abundant capital means the fewer acquisitions Constellation will win. Furthermore, business unit leaders and portfolio managers who have learned the M&A skill at Constellation and saved up a couple million there (remember CSI has minted hundreds of employee millionaires) can bid on VMS companies themselves. This is an especially high risk if their stock price gets very over-valued.
5) VC money or high public equity valuations spawn non-economic investing. Every time software company valuations become frothy, it creates an incentive to invest money in ways that show revenue, but have no ROI. A company may invest $10 to create $1 of revenue if that $1 of revenue is valued at 20x. Furthermore, some companies that want to show just usage statistics, in hopes of being valued on users, may give products way for free.
6) Mark Leonard and/or top management leaves. Since CSI is very decentralized, there isn’t quite one single person that can tank CSI. However, Mark Leonard is clearly very instrumental to setting the tone at CSI. Losing him could lead to lower employee morale and decision paralysis. Separately, according to some of our channel checks, there are only a dozen or so people at Constellation who really have a good grasp of all of the different companies in an operating group and are the M&A pros. Losing any or all of them would be a significant setback for CSI.
7) CSI invests in new markets poorly. CSI has noted they are open to investing in areas outside of their traditional VMS area. New investments could prove to be far worse than their past record.
8) New Software models hurt economics. The same way SaaS hurt the traditional enterprise software model, perhaps a new software model (like paying for software on the basis of some activity driver) could become popular and make the software industries economics worse.
9) Cyber Attacks. As a software provider it is possible one or many of their companies become prey for a cyber-attack. While attacks are common, increasingly sophisticated attacks could greatly increase the cost of supporting their businesses. Additionally, the result of a very public attack with ransom may not only be costly financially, but Constellation could also lose reputation and lose future business and acquisitions as a result.
Model.
Our model below is not meant to match with other exhibits, nor be a fair representation of what we think CSI is most likely to achieve. Rather the purpose is really to see how different items flow through and give Members something they can easily manipulate themselves. Frankly though, given the unpredictability of M&A, it is of limited value.

Conclusion.
Thank you for reading Speedwell’s first deep dive! Please let us know if you have any comments or concerns on this piece. We will also respond to questions at info@speedwellresearch.com, with the questions/ answers published in our discord (you may stay anonymous if you wish).


*At the time of this writing, one or more contributors to this report has a position in Constellation Software. Furthermore, accounts one or more contributors advise on may also have a position in Constellation Software. This may change without notice.