
This is our second Speedwell Research piece. In the process of making this report, we heard from dozens of employees, industry experts, consumers, professionals, and competitors, in addition to our own store checks. We hope you enjoy this piece, and learn a lot about the flooring industry! Please email us at info@speedwellresearch.com for any questions, concerns, or comments. See our full disclaimer on our website.

Business History.
Floor & Decor was founded in 2000 by George Vincent West in Atlanta, Georgia. A glassware salesman before joining his family’s business, West Building Materials, George West thought there was an opportunity for a discounted flooring reseller of closed out products. However, when he couldn’t find his wife the specific flooring she wanted, he decided instead that there should be a hard surface flooring specialty store that had a much wider selection than what a customer could typically expect to find at a home improvement center. In order to hold all of the extra SKUs and inventory, the store had to be larger than the typical mom & pop flooring store and specialize in nothing but hard surface flooring. Just two years after opening their first store, Floor & Decor was bought out by a group of investors who saw promise in growing it into a bigger chain. They would continue to grow store count up to ~25 in 2010, when they were sold again. This time, the buyers were large private equity funds, Ares and Freeman Spogli & Co.

In 2012, the new private equity owners installed Tom Taylor at the helm as CEO. Taylor had started his career at Home Depot at the age of 16, where he worked his way up to becoming Home Depot’s youngest store manager at the age of 22 and was ultimately promoted up to Executive Vice President of Operations. After a 23-year tenure at Home Depot, he spent several years at Sun Capital Partners as a managing director responsible for over 20 portfolio companies. With intimate operating experience in the home improvement space, bolstered by a deeper financial sense from his time overseeing many companies, he was the perfect fit for Floor & Decor. He doubled the store footprint while tripling sales to just over $1bn by 2016 year-end.

With Floor & Decor’s private equity owners in need of a liquidity event and the specialty chain showing moderate profits of $43mn for 2016, they IPOed on the NYSE in 2017. On April 27th, 2017, Floor & Decor listed on the NYSE as FND, selling 8.8mn shares at $21 each to raise a total of ~$185mn. Their original offering price valued the company at ~$1.7bn, but after a nice IPO pop, that figure increased over 50% to~$2.7bn just a day after going public.

Today, Floor & Decor operates over 170 stores and generated over $3.4bn in revenues for 2021 with almost ~$300mn in profits. They have a market cap just under ~$8bn (even after the market cut their valuation almost in half YTD). Despite their stellar growth over the past 2 decades, this story is still in its early innings with FND planning on more than doubling their footprint and taking market share from peers to become the indisputable leader in the hard surface flooring market.

We will now start our analysis with a high-level overview of the business and their core products before going into their operating model.
Business.
Floor & Decor is a specialty retailer and commercial distributor of hard surface flooring and related accessories. Hard surface flooring includes everything from Luxury Vinyl to wood and tile. Laminate and Luxury Vinyl is their most popular product category composing 26% of revenues with tile (23%) and Decorative Accessories & Wall tiles (19%) right behind.

We will first go through Floor & Decor’s product categories to get a better sense of what they are selling. Starting with their largest product segment, Laminate & Luxury Vinyl, they offer a variety of “good, better and best products” in this category that allow them to carry products at wide-ranging price points. The exhibit below shows a laminate flooring product on the left and a Luxury Vinyl plank on the right. Typically, vinyl is considered more water-resistant versus laminate as it is made entirely of plastic, but some advances in laminate technology has narrowed that difference—though vinyl is still more durable. The other big difference is that laminate looks more realistic as it texturizes the planks, giving it a more wood-like appearance. While vinyl is printed on grain texture, it can still be a rich color that looks very realistic. Because of these reasons, as well as better durability, vinyl might be more commonly found in a kitchen or bathroom whereas laminate is better suited for a living room. Floor & Decor has many (over 60) proprietary brands and products that have innovated on the form of flooring, improving water-resistance, durability, ease of installation, and appearance. The AquaGuard®, NurCore® and Duralux® brands are their most promoted.

Their tile offerings are their second largest product category at 23% of 2021 revenues. Below, we show ceramic and porcelain tiles. Many tiles can be used either as flooring or on walls. The main difference between porcelain and ceramic is that porcelain is pressed at a higher pressure, which makes it more durable and more waterproof, and thus more suitable for outdoor or heavy commercial usage.

Their 3rd largest category is decorative accessories / wall tiles, which constitutes another >700 SKUs that are commonly used as backsplashes, for showers, or just to add more character to a room. (The distinction between these wall tiles and the tiles above is that the materials for the tiles above are strong enough to be used on floors or walls, whereas wall tiles are typically not suitable for floor usage). This category represents 19% of 2021 revenues.

Their next largest category is installation materials & tools (16% of revenues), which includes grout, mortars, underlayment, sealers, molding, sealants, and tools. Carrying these products completes Floor & Decor’s offerings, making them a one-stop shop for everyone from flooring professionals to DIY consumers who want to install things themselves.

Their other product categories include wood flooring (8% of revenues), stone (6% of revenue) and adjacent categories (1%). They sell a variety of prefinished and finished woods in a variety of sizes and stone cuts in a range of sizes directly sourced from the quarries. Their “adjacent categories” includes custom countertops, glass shower doors, vanities, vanity mirrors, vanity tops, bathroom sinks, bath faucets, shower faucet sets, and bath accessories. The adjacent category is their newest, and despite their growth in product selection here, they still intend to primarily be a flooring retailer while offering these other items as a convenience. This category is growing quicky and they have a longer-term goal for it to reach ~5% of total revenues (from 1% today).

Adding these product categories together gets us ~$3.9bn in LTM revenues. They store and sell their items namely through their network of warehouse stores but have recently been adding other sales channels that leverage their warehouse footprint. Before moving into new channels and sales initiatives, we want to first go into the Floor & Decor operating model.

Operating Model.
The Floor & Decor model starts with the warehouse. Similar to Costco, their stores are massive, averaging 78,000 square feet each, with little distinction between the backroom and retail front. This allows them to carry not only more selection than their peers, but also far more in-stock inventory, as this format turns an inventory stockroom into a storefront. Each item display is backed by stacks of wood pallets of inventory, which allows customers to easily help themselves by reducing the friction to getting items onto their dollies or into their carts. With square footage several times the size of a normal format store, their average store carries 3-4x more in-stock SKUs than the largest home improvement centers. Their micro-merchandising model gives each store’s Chief Executive Merchant or CEM (their version of store manager) the autonomy to pick the best mix of flooring offerings for their local market, as style popularity varies by MSA (metropolitan statistical area). This means that not only does Floor & Decor offer more selection, they also have more items that are better suited to the local market.

It’s not always easy for a customer to find what they want given the ~2,000 flooring SKUs per store, which is why Floor & Decor introduced in-store designers who help them pick between their vast array of different flooring options. This not only elevates the customer experience, but also increases the likelihood that a customer completes a purchase, simultaneously increasing average ticket size. Even beyond the designers, the average employee is well versed in flooring and installation, making them capable of giving customers the expert advice they may require before feeling comfortable completing a purchase.

This deep knowledge of products is also helpful to professionals who want to get in and out quickly. Floor & Decor helps the pros out with their app that allows pros to order products ahead of time and pick it up curbside, a Covid innovation that remained in place due to wide popularity. Pros are further served with a dedicated Pro desk in each store, free 7-day storage, site delivery, and the privilege to take samples out for free. Incentivizing the pros to make Floor & Decor their exclusive flooring retailer is their PRO Premier Rewards loyalty program that allows them to earn points that can be redeemed for 3rd party business services like marketing tools or personal indulgences such as vacations. With pros directly responsible for 40% of purchases and influencing another 45% of customers purchases, providing them great service is essential.

However, what Floor & Decor doesn’t do is just as critical as what they do do. They focus on competing on service, selection, and in-stock inventory, typically never discounting nor offering special pricing to pros. Instead, they offer everyday low pricing. Their everyday low pricing model is similar to Costco, which removes the incentive for a customer to delay purchasing while ensuring their prices are always competitive versus peers. Floor & Decor offers a single price, which is their best price, to all customers. They source directly from the manufacturer, cutting out the middleman, which helps them price very competitively. Their success has allowed them to continue to increase their purchase orders with manufacturers, which drives their prices down lower as the manufacturer benefits from economies of scale and Floor & Decor uses their bargaining power to extract a portion of that cost savings, which they then pass along to the customer. This is a classic flywheel whereby growing scale begets larger orders, which decreases cost per unit and thus consumer pricing, ultimately spurring further increases in demand.
Directly sourcing also allows stronger quality control. This particularly can be an issue in the building materials industry where potential liabilities, stemming from the chemical-intensive nature of the products, can overhang for decades. Sourcing itself isn’t easy though, with FND managing 240+ suppliers in 24 different countries, who they must each give large enough orders to in order to get preferential pricing. A shortage of a product with one supplier in one country must be sourced elsewhere, requiring a fairly competent and comprehensive sourcing network. The trade war, with sporadic tariffs, only further exemplifies the value in quickly being able to move between product sources.
All of this is provided by their 170+ warehouse store network, which is rapidly growing so the average customer can get to a store in ~30 minutes. The Floor & Decor value prop is simple: the largest selection, the most in-stock inventory, very competitive prices, and great service. We will touch back more on this and how it stacks up to competitors later on.

Floor & Decor namely sells their products through their warehouse format stores, but they have added several other sales channels since.
These five sales channels are:
1) Warehouse format stores: This is their #1 sales channel, although admittedly the lines between different channels are blurring. Their warehouse network consists of 170+ stores that each average 78,000 SQFT and 4,300+ SKUs. Longer-term, they think they can have at least 500 total stores in the United States (including design studios), up from their prior forecast of 400 at IPO.

2) Website and Mobile App: 16% of sales now come from their ecommerce channels, but 80% of customers who have purchased something at a warehouse have visited their website, showing how their website is an important funnel and conversion tool to push customers to in-store visits. Of those 16% of total sales that are completed online, 79% are picked up in-store, which displays the importance of being omnichannel in this category. If the customer doesn’t buy online, getting them to visit a store is a good consolation as 80% of people who visit a Floor & Decor end up buying something.

3) Design Studios: The design centers are one of FND’s newest initiatives. While they had a single design center store in Georgia before their IPO, they hadn’t seriously considered building out this store format until a few years ago. In short, the rationale is that their warehouse stores are too large for many metropolitan markets, but a smaller-store format which displays their selection and is supported by a local warehouse store for quick delivery could help extend the reach of each warehouse. Similar to their online efforts, the design centers should be thought of as supporting their core warehouse stores. Longer-term, they currently think they can have 30-40 design studios (versus 5 in 2Q22).

4) Regional Account Managers (soft spec): The Regional Account Managers or RAMs as FND calls them, are basically sales reps that focus on a specific part of the commercial market. Floor & Decor splits the commercial market in two: 1) the market that has hard product specifications and long lead times which is typically serving Architecture & Design firms and 2) the rest of the commercial market that has soft or no product specification and is usually serving building owners, developers, and general contractors. Hard product specifications means that the buyer knows exactly what they want and might ask for a Bangor Hard Maple ¾ inch thick with planks 3¼ inches wide, whereas if they have “soft specs” they might ask for only a light, smooth hardwood with the rep helping guide the selection. The RAMs serve the market with soft or no specs, so they are able to push buyers towards a variety of different FND products. They currently have several dozen RAMs with a long-term goal of reaching 300-500 commercial reps, who they think can each generate $3-5mn in sales.
5) Commercial Distribution (hard spec): This sub-segment of the market is the 60% of the commercial market that is hard specs. Floor & Decor entered this space through their 2021 acquisition of Spartan. The idea was that Spartan would act as a sort of platform acquisition in this vertical and they would continue to grow it organically or through tuck-in M&A like with their acquisition of Wisconsin-based distributor KRS (similar to how Constellation Software would do a large platform acquisition to enter a software vertical and then build off of that with smaller acquisitions). While this vertical is still a small portion of overall sales (Spartan was 2-3% of revenues in 2021), it is additive to their store network and could be higher margin as well. They don’t give the exact margin structure, but note that this segment (as well as the RAMs) has much lower SG&A costs associated with it. However, they do offer bulk discounts that drive gross margins lower (more on this later). It is smart to segregate their discounting to a specific channel that is out of sight for their core consumers as it shouldn’t change the retail customers’ buying habits or expectations.
Floor & Decor’s multi-channel strategy allows them to go to where the sales are, segregating their customer base to better serve them without creating added channel conflicts and all while leveraging their existing physical footprint to increase sales.
For fiscal 2021, Floor & Decor surpassed $3.4bn in revenues, grew 42% y/y, and are on track to exceed $4bn this 2022. This is incredible considering just a decade earlier, in 2011, they reported $276mn in sales, which is a ~30% CAGR over the last decade.

This has been driven by both new store growth and improving sales per store. When they first IPOed, they were generating only $14-16mn at mature stores. That figure has now reached ~$28mn, with each new cohort of stores generating more at opening than the prior vintage. Same store sales (SSS) has averaged ~15% y/y for the past decade, despite new stores opening at higher revenue levels than the earlier cohorts and FND having grown stores over 5x. From 2012 to 2Q22, they grew their store footprint from 30 to 174, with FND planning on getting to 192 by 2022 year-end. For a decade, they have grown stores over 20% annually and intend to continue at that pace for at least the next few years.

Their current target is to reach 500 stores in the US, a figure which was updated from 400 in 2021. To better understand their market and whether their targets are too ambitious, we will dive into the industry next.

Industry and Market.
Floor & Decor’s core TAM Is the hard surface flooring market, which mainly includes laminate / vinyl, hardwood, stone, and tiles. The hard surface flooring market has grown at an average clip of 4% since 2016 and they expect roughly the same market growth rate in the future. Supporting this are all of the variables you might guess: remodeling of aging housing stock, household formation growth, increasing home equity value, and existing homes sales. (New home sales is not an important demand variable for them, so they are not as susceptible to a housing market slowdown).

More unexpected, though, is the magnitude of the secular shift from carpet to hard surfaces. Historically, carpet was the best, cheapest flooring option, so millions of homes in America were laid with carpet. Fast forward several decades and not only is this stock of carpet stale, but advents in vinyl and laminate flooring have improved in quality, durability, and ease of installation, while decreasing costs, has made carpet much less attractive. As a result, in the past 9 years alone, carpet has ceded 13 points of market share to hard surface flooring.

While we do not take an opinion on where the carpet market will ultimately shake-out, we believe it is more likely than not to continue to be a share donor to hard surface. Also, remember that these two are not always mutually exclusive as hard flooring with an area rug is very common (the TAM figures only include installed carpet).

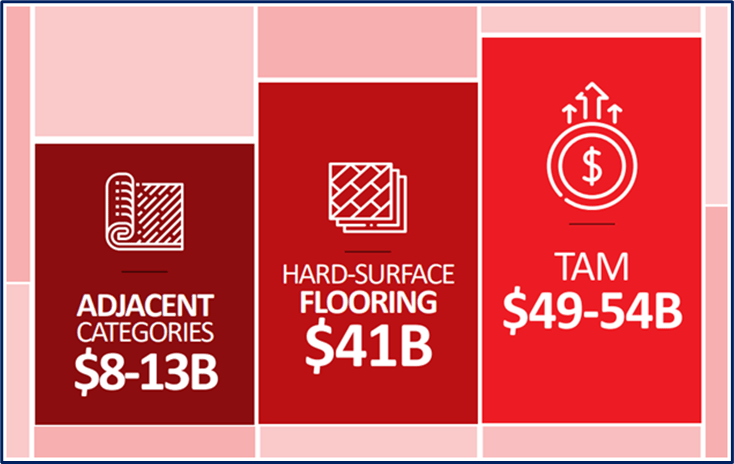
Floor & Decor estimates the hard surface flooring market to be $24bn in manufacturer’s dollars, which they gross up to $30bn to get their retail TAM. (This grossing up from $24bn in manufacturer’s dollars to $30bn in retail implies just a ~20% gross margin, but public flooring companies have gross margins of at least twice that. This either means there is an issue with the TAM estimate or there is a lot of wholesale flooring that is sold at a gross margin below 20% to make the math work). LL Flooring, a competitor, similarly estimates the hard surface flooring market at $31bn. Layering in $11bn for installation materials and tools yields a combined TAM of $41bn. There is also the adjacent category TAM of $8-13bn which includes their newer verticals like shower doors, vanities, light fixtures, faucets, etc.
FND ultimately expects much smaller penetration of the adjacent category TAM compared to the hard surface flooring market (about 4-6% market share in adjacent categories versus 40% for flooring if we take their targets on the current market size of $41bn. The longer it takes for them to reach their goals though, the lower the market share assumption will be as the TAM grows each year). As mentioned, they have a longer-term target of 500 stores between their warehouse format stores and design studios, which they expect to earn an average at $30mn each. They also have a goal of $1.5bn in commercial sales and $500mn in adjacent categories (or $1mn per store) to get a total target of $17bn in sales.

They have put an 8-10-year timeline in their 2021 10k on their targets, but some other commentary suggests it could be sooner. If they grow stores at a 20% clip as they have mentioned, it will only take 5-6 years to reach 500 stores from their estimated end of 2022 count of 192. Given that they also give us an assumed market share figure of ~33% and noted that they expect the TAM to grow 4% annually, we can back into a second estimate of 5 years for them to reach their targets ($16.5bn / 33% = $50bn, which the TAM would grow to in ~5 years from the base of $41bn. You would have to assume the market stopped growing thereafter for them to hit their sales goals with that market share assumption otherwise). This suggests that either something is wrong with their TAM analysis or that their 8–10-year store forecast was too conservative (we think it is the former).

This implied timeline seems too aggressive in our opinion, but whether it takes another year or two to grow to that store level will not have a material impact on FND’s investment merits. The real concern is whether they ultimately get there, not whether it takes them a couple of extra years.
Supporting their recently increased store count is 1) stronger unit economics which allow them to serve smaller markets profitably, 2) less lasting cannibalization than was originally anticipated, 3) better real estate availability than when they did the original study, and 4) their smaller design studio store format that extends their reach. Below you can see some of their demographic targets from their 2022 Investor Day.

As we have alluded to in the operating model section, Floor & Decor is able to cater to a variety of different customers. To zoom into their $41bn hardwood flooring TAM, they split it up further in terms of commercial and retail, with the commercial TAM estimated at $16bn and retail (or R&R) at $25bn (R&R typically stands for remove and replace in construction contexts, but they do not specify the acronym in their presentation). Within the $16bn commercial TAM, they split it up again, with 60% of that called “specifier”, which is the business with hard specs that mostly serves A&D or architecture & design firms (where Spartan operates) and the other 40% of that commercial TAM they call “main street” that is focused on the soft specs or no specs where their RAMs focus. The diagram below should help clarify these figures.

Within the R&R market though, there are a further 3 different types of customers we can look at:
1) DIY or do-it-yourself (15% of customers). These customers complete the installation themselves without relying on any significant outside experts to complete their project. These customers tend to know a lot about home improvement, but still value knowledgeable staff that can help them execute their specific project idea. They tend to be customers looking to save some money by making installations themselves, so FND’s low prices, experienced staff, and full assortment of installation materials is a perfect value prop for them.
2) BIY or buy-it-yourself (45% of customers). These customers purchase the materials themselves, but then rely on an expert installer to complete the project. In most cases, they ask their installer where they should look for flooring and then purchase it themselves for the professional to then install. Since the professional installer is sending the customer to a flooring store to pick out material, they would be more reluctant to send them to a store that also does installation (like Home Depot or LL Flooring—more on this later). Additionally, the large variety of selection and price points at every Floor & Decor allows a customer to feel like they have seen the full set of their options after visiting just one store. This is why 80% of consumers who visit a Floor & Decor in-person end up purchasing something there.
3) Pro or professional (40% of customers). These are professionals who specialize in flooring installation. They usually work for themselves or are employed in a small business. They often have more than one source they can get flooring materials from, but they value the convenience of getting everything at one place. Additionally, FND’s push into pro loyalty programs gives them more of an incentive to move all of their purchasing to Floor & Decor. FND is catering to pros through curbside pick-ups, free samples, having a dedicated pro service area, and no restocking fee so that they can take more material than they may need and return any excess for free. Lastly, their loyalty program enables pros to earn points for each purchase that can be used on business services like scheduling software or marketing, in addition to more personal options like travel (they also allow BIY customers to say who their pros are so that the pro gets points for the sale, further incentivizing pros to recommend FND). These efforts are in addition to their core value prop—having the most in-stock inventory across the greatest selection at the lowest prices. Their in-stock inventory and installation materials are crucial to keeping a pro’s job schedule on time, so that the pros keep their customers happy and don’t lose their jobs. While pros influence 40% of sales today, they install a total of 85% of purchases. Thus, serving pros well is critical to ensuring they recommend Floor & Decor to BIY customers.
We will now move to the competition, going over how FND stacks up to competitors.

Competitors.
Floor & Decor has 4 core sets of competitors: 1) home improvement centers such as Home Depot and Lowe’s, 2) specialty chains like LL Flooring and The Tile Shop, 3) independent stores, and 4) distributors. The industry is fairly fragmented with the largest players Home Depot and Lowe’s at an estimated 22% and 12%, respectively. Management quotes Floor & Decor at 8% in their investor day, but we estimate that it is closer to 10%. Either way, there is plenty of room to grow, particularly from the independent retailers, which are an estimated ~1/3rd of the market.

Below is LL Flooring’s TAM estimates. They estimate the home improvement centers are closer to 37% of the market (our ~34% estimate, informed from public disclosures, is in between the two). Their different categories make it hard to compare the two, but generally we think of the market as being ~1/3rd independent, ~1/3rd home improvement center, and 1/3rd specialty and distributors.

Before going into our granular competitive analysis, below is a high-level view of how Floor & Decor views their competitive position. We think Floor & Decor doesn’t give its home improvement center competitors enough credit for the quality of their service. Additionally, while it’s true that the assortment at the home improvement centers is about a quarter of FND’s, it’s worth remembering that the utility of greater selection is not linear (i.e. the first 500 SKUs of flooring matters much more than the next 1,000).

Below is, at a high level, how FND sees their competitive position. Note the focus on selection and in-stock selection. These are two of Floor & Decor’s most important differentiating factors.

We will now dive into the larger competitors that Floor & Decor faces.
The Home Depot.

Home Depot is arguably FND’s biggest competitor today. Home Depot has vastly superior brand awareness, knowledgeable employees, 2,000+ conveniently located stores, and sells more than 2.5x the amount of flooring FND does—at ~$9.2bn for 2021—a figure that has been growing at ~7% annually since 2016. This suggests that Home Depot has gained share, and ostensibly the larger they become, the more they can push their volumes to manufacturers to reduce the manufacturing costs and ultimately the prices they charge consumers. However, there is a limit to the economies of scale they can reap, and at some point, sourcing enough flooring becomes an issue, especially since laminate and luxury vinyl have enjoyed continued robust demand. On sourcing and pricing, FND seems ahead of Home Depot but both companies have comparable pricing and were able to navigate the China tariffs and the pandemic reasonably well. FND directly sources all of their products whereas Home Depot still often relies on distributors like Shaw and Mohawk to stock their stores. Because of Home Depot’s scale, they are still able to get pricing similar to Floor & Decor, but on certain SKUs FND has them beat (more on this below). The fact that even Home Depot doesn’t do all of their own direct sourcing for this product category speaks to the complexity of globally procuring inventory for thousands of SKUs across hundreds of manufacturers in dozens of countries.

Prices between Home Depot (HD) and FND tend to be similar, but it’s hard to compare head-to-head as products are not standardized and can vary in quality and features like waterproofing. We could find products within each category at similar prices (as low as $0.90 and up to $5+ for luxury vinyl), but whether some shade of dark oak is truly comparable to another can be debated. By and large though, we would say FND is as cheap as, if not cheaper than, HD. (In fact, one Floor & Decor chief executive merchant we spoke with was emphatic that he would not be beat on price and would be willing to price match. Another non-FND source admitted that they were much cheaper than Home Depot, but we couldn’t find consumers that were emphatic that the difference was that material. The Pros we spoke with didn’t mention Home Depot as being more expensive).

The big difference between Home Depot and Floor & Decor is the amount of selection and in-stock inventory. FND estimates that the home centers have around 630-680 flooring SKUs with 400-450 in stock, but when we did our store checks we saw closer to the lower end of that in Home Depot (we estimated ~400 on display). Either way, Floor & Decor has 3-4x more flooring SKUs than Home Depot with much more inventory in-stock. The Home Depot reps we spoke with quoted 4-7 days to get some out-of-stock SKUs delivered. However, they do offer to deliver directly to you, which will be good enough for many customers earlier in the flooring process, but not for those that are later in the flooring purchase journey. If you think about the “flooring journey” from discovery to purchase to installation, the earlier a customer is in the journey, the less sensitive they would be to timing delays. However, almost by definition, the contractors and installers are always in the “last step” of that journey and so they value in-stock inventory the most. This is because waiting for stock to come in creates uncertainty in their work schedules, which makes it hard to plan jobs and could cause them to miss work opportunities. For builders, waiting for inventory to come in means more time an apartment could sit vacant, costing them rent.

Where Home Depot beats Floor & Decor is in two important and related areas: brand awareness and trust. Many consumers go to Home Depot simply because Home Depot has customer mindshare as the “go-to” place for any renovation project. This means that if a consumer is not particularly discriminating in flooring, they will just go to Home Depot and pick something out without further research, knowing that Home Depot is a good enough option and trusting that if anything goes really wrong, Home Depot will make things right. This is not only a benefit of being ubiquitous and carrying a generally strong reputation, but also owing to the lack of dominant brands in the flooring industry. Given that the average consumer doesn’t know any brands, and most retailers have their own proprietary brands that are hard to compare anyway, the reputation of the retailer supersedes the product’s. A consumer would be comforted buying a product knowing that Home Depot carries it, whereas if they are buying a Weber barbeque, they would be more channel agnostic and would usually google it to price check. (The flooring category is very hard to “google” or compare on the internet, a factor that gives flooring retailers more importance in guiding purchase decisions).

The other advantage Home Depot has is when someone does a larger remodel and wants to purchase everything from a single store for the convenience. Adding to convenience is the fact that Home Depot offers installation services so a customer doesn’t have to vet different installers and can just trust the Home Depot option (though this can be a negative in attracting pros as they feel like Home Depot is competing against them). Lastly, Home Depot is also preferable for those who can get overwhelmed by too many options and may find an 80,000 Floor & Decor warehouse too daunting.
Ultimately, what all of these comments are dancing around is the Consumer Hierarchy of Preferences (introduced originally here). The Consumer Hierarchy of Preferences is the idea that consumers have an internal ranking of desires (similar to Maslow’s Hierarchy of Needs) and once a consumer gets one of their preferences filled to a degree, getting their next order preference served becomes more important. Once a company addresses an adequate number of the consumer’s preferences they will make a sale, but if they can meet more conditions on a Consumer’s Hierarchy of Preferences beyond that, they are effectively building consumer surplus (this is when companies go beyond what they need to do). Each of these companies has a different value prop that hits on the Consumer Hierarchy of Preferences differently. Home Depot does best with customers who want a trusted provider to get a job done with reasonable assurances of quality and good enough selection with minimal hassle. For the customers that value selection, in-stock inventory, and design help, Floor & Decor has the best value prop that fits their preferences.
We will compare company-specific metrics later in this report, but Home Depot is a very well-run company with a strong value prop, just a value prop that is different from Floor & Decor’s. Nevertheless, Home Depot will continue to demand a large and likely growing portion of the flooring market.
Lowe’s.

Lowe’s positioning and value prop is very similar to Home Depot. Their store layouts are similar, and the amount of space dedicated to flooring is also comparable. Home Depot has a slightly larger store footprint than Lowe’s (2,000 stores vs 1,700), but they are both in the same league with regards to national store coverage (Lowe’s stores are ~10% larger on average). Lowe’s generated ~$4.9bn in flooring sales for 2021, about half of Home Depot’s sales.

Home Depot has made more progress with their distribution centers to expedite shipping compared to Lowe’s, who just a couple years ago was taking up to two weeks to get some flooring SKUs in stock (versus Home Depot closer to a week at most). Lowe’s is basically trying to copy Home Depot after learning that they cannot copy Floor & Decor. In 2019, Lowe’s ran a test in two of their stores to try to copy the Floor & Decor model but quickly learned that they couldn’t. Despite the reduced number of SKUs, they were not able to dedicate enough space to the category and still struggled to procure enough pallets of inventory to prevent out of stocks. They also had issues trying to go directly to the suppliers as their infrastructure wasn’t set up for it and their volumes couldn’t support it. They made some lasting changes from their flooring experiment, such as drastically cutting back on carpet selection and building out bulk distribution centers (like Home Depot did), so they are better suited to go directly to the suppliers and buy in bulk, but they still are largely relying on wholesalers like Shaw and Mohawk. That said, Lowe’s still has a greatly reduced array of selection and worse in-stock inventory levels. This trial shows us the value of the Floor & Decor model and how you cannot easily copy their value prop without going all in. The need to directly source from manufacturers seems to be a particularly thorny problem for competitors to solve.
LL Flooring.

LL Flooring is a specialty hard surface flooring retailer with over 400 smaller-format stores that focuses just on wood and wood-styled materials such as laminate and vinyl. They are the largest specialty chain store other than FND. They were formerly known as Lumber Liquidators, but they renamed themselves after a large scandal resulted from selling flooring with poisonous amounts of formaldehyde (although even without the scandal it seems like a rather poor name as a rep complained to us that he would get many calls from people who wanted an actual raw lumber liquidator). This scandal was originally exposed on a 60 Minutes exposé in 2015 and resulted in hundreds of millions in losses from various lawsuits and lost business (additionally, there was a second, smaller scandal related to purchasing illegally-logged lumber in Russia). Their founder and CEO, Thomas Sullivan, parted ways with Lumber Liquidators in 2017, but was later sued by the company for violating a non-compete clause. In 2019, Sullivan attempted a take-over of Lumber Liquidators, but exited his position after the shares popped. All of this has kept management sidetracked, with sales and earnings still lower than their 2014 levels.

Post-scandal, many consumers we spoke to had a sense that Lumber Liquidators has a sketchy past, and once they made the connection that LL Flooring was Lumber Liquidators, were unwilling to shop there. (It is odd that they sometimes put Lumber Liquidators under their LL Flooring logo, which elicits that exact association that you would think they are trying to avoid).

However, many people don’t follow the flooring industry that closely, and the stores’ convenient locations with all of their products laid out in an easy to view format appeals to some. They also partner with 3rd parties to offer their own installation services, which is something FND purposely avoids for fear it will conflict with their efforts to attract Pros (FND does fork customers who want installation over to an unbranded site where pros can voluntarily opt-in to receive leads. Since Pros recommend customers to stores and can often take them there themselves, they would be more reluctant to if FND was loudly promoting installation services to their clients like LL Flooring and Home Depot do). LL Flooring’s service revenue amounted to ~$150mn for 2021, but it is about half the gross margin level as their merchandise sales at 22% vs 44%. (It is interesting that their gross margins are higher than Floor & Décor’s, as FND has much higher volume. The original tip-off that preceded their scandal was a short seller noticing their gross margins were much higher than peers). While their prices generally seemed in the same ballpark, many SKUs seemed lower quality and a few samples were visually peeling in the corner (perhaps explaining their higher gross margins). Other customers were more indifferent to what we perceived as lower quality though. They do offer different rates for pros who buy in bulk, which some installers appreciate as it allows them to take a portion of the discount for themselves. But that comes at the cost of some consumer trust, which is why one of Floor & Decor’s selling points is one everyday low price for everyone. In 2021, they generated just under $1bn in revenues in merchandise revenues, a figure that hasn’t grown much over the last 5 years and is still lower than their 2014 sales.

While LL Flooring has a slew of new initiatives from their rebrand and revamp of stores to a focus on pro sales and improving brand awareness, they have continued to be a share donor, growing at just ~2% over the past half a decade (versus low double digits pre-scandal). Their low amount of on-hand inventory with most SKUs taking at least 3-4 days to arrive, smaller selection, inferior sourcing, lack of designers, and very limited installation materials & tools with slightly lower quality makes LL Flooring a somewhat fangless competitor to FND.

The Tile Shop.

The Tile Shop is another specialty retailer with >140 stores in 31 states, but, as the name suggest, is focused just on tile. Each store averages 20,000 square feet and they offer over 6,000 natural stone and made-made tile products. This product selection includes wood-looking tiles too that can be a vinyl or hardwood substitute. They are slightly higher-end than Floor & Decor or Home Depot, with very limited selection under $3-4 / SQFT.
Each store has dozens of what they call “vignettes” that display their products in small displays. Floor & Decor has small set ups like this in their design centers, which they are adding to older stores, but The Tile Shop has many more of them showcased all through their stores. We think this makes shopping very easy and many consumers will value how The Tile Shop imagines rooms for them.

The Tile Shop does not operate on the West Coast today, and despite run-rating a much lower level of revenue compared to FND at $370mn for 2021, they have only grown sales at a 4% CAGR since 2015. Their gross margins are very high, around 68-70%, but they still struggle to generate more than a high single digit operating margin (their gross margins are high because they have higher mark-up on products. One FND source saw a tile they carried for $2 on sale for $5 there). The Tile Shop today is too small to be a strong competitor to FND and their small absolute profits will limit their ability to invest, but they are worth monitoring.

Floor & Decor has a design section at the front of their store that serves a similar purpose. Here, customers can not only get inspiration from different designs but book an appointment with a designer to go over different design possibilities. Designers and design displays have become more of a focus for FND after they learned that customers who work with designers are more likely to purchase something and spend more. The design displays help draw customers into the design area who often end up making their own free design appointments.

Other Competition.
There are many other specialty retailers that are more regional, such as Bedrosians, Ann Sacks, Menard’s, and Simply Floors, among others, but none of these are singularly a big threat to FND today. In aggregate, more specialty retailers may be able to take more share, but it seems somewhat unlikely given that Floor & Decor’s biggest value prop is selection, price, and in-stock inventory, which is hard to compete against at sub-scale. These smaller specialty chains and the independents can win on superior service, moving up market with higher quality and offering more boutique items, but doing so also doesn’t threaten FND’s grip on their core consumer.

The biggest threat, in our view, to Floor & Decor is if there was another player that could match their level of in-store stock across as much quality selection with low prices. We think these factors are the most meaningful for most of their customer base. However, it is hard to see how anyone can mimic their consumer value prop without a willingness to devote a large amount of square footage to just flooring in each store. LL Flooring, The Tile Shop, and other specialty chains do not seem interested in moving to a warehouse format, and flooring is just but one of dozens of categories that Home Depot and Lowe’s sell. The more Home Depot or Lowe’s focuses on hard surface flooring, the more they risk relegating other important categories. Home Depot and Lowe’s can buttress their offering by building out their distribution centers and trying to streamline their logistics network such that they can greatly improve their delivery times, but even that will not be enough for many customers who require they have the inventory immediately upon walking into the store.
The need for instant inventory is similarly why Amazon would have trouble gaining share, in addition to the fact that customers often like to be able to see and touch the product. You can buy flooring on Amazon today, but quantities are not that customizable and it’s hard to sort through who is a reputable seller (most listings are 3rd party merchants). Quality is hard to vet and plenty of customer complain about unresponsive sellers. In short, it is a hassle that negates the convenience that Amazon customers typically value. However, Amazon could always team up with another retailer (like they did with Best Buys and appliances), which could prove to be a more formidable competitor offering.
We will now quickly go through how Floor & Decor comps operationally and financially compared to peers.

Peer Metrics.
Below, we show how gross and operating margins vary across their competitive set. FND notes that various supply chain related issues and higher than usual transit costs have increased their COGS as they capitalize transit costs in inventory (which then reduces gross profit when the inventory is sold), but their peers would be in a similar situation. (Floor & Decor was actually positioned better than most when transit costs spiked because they had some 5-year transportation agreements that were struck before the energy crisis and supply chain issues). The small, independent shops, on the other hand, have been struggling to keep their costs as contained.

FND runs at a 41% gross margin, but that could increase as some of the transit and energy issues abate over time. They ultimately have guided to a high-teens EBITDA margin with ~300bps of D&A, which gets us to a ~15% mature margin, similar to where HD is today.
Below, we show inventory turnover and see that FND does about 2.4x inventory turns annually, which seems only moderately better than LL Flooring prima facie. However, the problem comparing the two is that Floor & Decor will typically buy inventory for stores ahead of opening, and, given the supply chain issues, they have been ordering more inventory earlier than they would otherwise. It’s odd to think about, but embedded in their inventory figures is “growth inventory”, or inventory that is required to grow store units, but is not currently available for sale. This drags down their turnover ratio. On their analyst day, they noted that they need ~$3mn in inventory per store with another $600-800k in replenishment inventory behind it. Accounting for this growth inventory raises their inventory turnover ratio approximately 0.1x to 0.2x. (It is worth noting that there is less inventory obsolescence risk with flooring and thus less of a need to discount if something doesn’t sell, which allows them to carry higher inventory levels more comfortably).

They currently have 4 massive distribution centers with another two planned for the East Coast in the future, but if those distribution centers can serve their growing store base, then they could start to see a meaningful lift in inventory turnover as a mature store does ~$28mn in sales with only ~$4mn in inventory in it (7x store-level inventory turnover ratio). Allowing them to increase inventory efficiency could help improve cash flow as only ~66% of inventory is currently merchant financed. However, we don’t think this is likely to show through until they are closer to maturity in store growth.

FND financing 66% of inventory with accounts payable is slightly better than HD or LOW and a step-function better than LL and TTSH. (For some context, AutoZone, a secondary auto parts supplier who has possibly the best working capital management of any company that deals with physical inventory has been able to achieve around a ~130% A/P to inventory ratio. Not that we think FND will be able to mimic their playbook to that extreme). Merchants extending less financing to LL and TTSH means that it will be more capital intensive in order for them to grow, and is a competitive disadvantage.
Now with a firm understanding of Floor & Decor’s value prop and competitive position, we will dive into store unit economics and then ROIC.

Store Economics.
Floor & Decor has grown stores from just 30 stores in 2012 to over 160 at 2021 year-end. In the next 3 years, they intend to add 115 stores, almost the same number of stores they added in the prior decade.

This level of store growth is made possible by strong unit level returns and an experienced and competent management team. Each new store ties up around $8-10mn in capital (includes pre-opening expenses of ~$1.3mn and inventory net of payables of ~$0.5mn). In the first year, a store will generate around ~$15mn in revenues or >$2.5mn in store-level EBITDA. By year 3, a store’s EBITDA is increased to >$5mn. They quote an average payback period of 2.5-3.5 years per store, which is phenomenal. Using EBITDA as a proxy for cash flow, management notes that in year 3 they are achieving a 50% cash on cash return. These are especially strong returns considering they continue to increase as the store ages.

Management has disclosed that mature stores (usually 5 years after opening) generate $28mn and that when stores age 5+ years out, they get close to a 25% EBITDA margin, or about $6-7mn in EBITDA per mature store. This means that taking the high end of the capital outlay at $10mn, and with ~300bps of D&A and taxed at 15%, they are making a 17% return on capital in year 1. This continues to grow as the store’s ramp-up in volume to almost ~$5mn in NOPAT by year 5, or a 50% ROIC (IRR comes out to over 30% assuming they don’t make anything in the first year, which is an unrealistic assumption). These are incredibly compelling unit economics figures.

They have noted that they believe total company mature EBITDA margins are in the high-teens range versus 25% at the store level for mature stores. Even if you burdened the stores with corporate overhead of ~700bps, each store still earns a mid-30% return on capital.

There is some cannibalization (10-20%) when they roll out new stores in the same market and depending on the opening store mix for the year (whether they are disproportionately in new markets or existing), which can throw off the same store sale comps (much to Wall Street analysts’ dismay). However, after 1-2 years, they return to growth and their growth trajectory normalizes to the typical store. Management observing this cannibalization period passing is partly what made them realize they could support more stores in an existing market than they originally thought.
Management also notes that each store cohort they opened has performed better than prior ones. So while stores used to do just $9mn in the first year, they are now doing closer to ~$15mn. SSS growth has averaged 14% since 2012, but that is helped by the new store openings that take ~5 years to fully ramp up. However, even once a store reaches maturity, management noted they are still comping mid-single digit SSS growth. (They disclosed that their best stores are running >$400 per SQFT, which equates to >$31mn in revenue per store, and is still growing). They are now buying more of their new store locations and building them out themselves versus leasing because they can get better locations and build to their specs, which could be another boost for future stores to be stronger than the prior cohorts.

The big dip in same store sales shown above for the 2017-2019 period has a few variables that explain such a drastic fall off. The first factor is an especially strong comp period owing to Hurricane Harvey in 2017, which they quantified as an 800bps impact in 4Q17 alone. The other factor is the timing of new store openings and the portion of stores that are opening in new markets versus existing markets. As mentioned, there is some level of cannibalization in the 12-18 months when a subsequent store opens in an existing market. For those years, more stores were opening in existing markets.
In 2020, their SSS exceeded prior levels as the pandemic created a boom in demand as more consumers were staying at home, and flush with stimulus checks, renovated their homes. Floor & Decor was ready to meet the demand spike with their developed ecommerce capabilities (they have been testing small changes for a while, like adding a picture of a room to each SKU, which increased conversion ~25% according to one source) and rolling out curb-side pickup. On the back of such a strong year, we are seeing transaction growth down, but average ticket growth still up.

Average ticket growth has been driven by a mix shift towards “better” and “best” product selections (within the “good, better & best” product categories they have) as well as the uptake of in-store designers, which drive the total purchase price up. Additionally, there is some price increase from inflation. Their cost of goods hasn’t increased significantly (material costs are purchased internationally and the US dollar has been strong), but energy costs and other costs borne in the US have definitely increased. Management has talked about being able to pass off cost increases to get the same gross dollar profit per unit, but not necessarily margin. This could be problematic if their capex costs increase, but they can’t keep their gross margins flat, as that would imply a falling ROIC (since turns are unchanged). Their gross margins for 2H22 are down to 39.8% from 41.4% for full year 2021, which they attribute to higher supply chain costs. Longer-term, we think they will be able to restore gross margins to 41% (if not increase them), but if costs continue to rise and they feel they can’t take price up for fear of losing demand, then that will be problematic in the short-term.

However, if they do have an issue containing cost in the long run and maintaining margin, you can bet that everyone else will be in the same boat. Under such a scenario, it is likely FND gains market share as other independents and the smaller specialty chain stores struggle to contain costs as well as Floor & Decor with its global supply procurement team and long-term transport contracts that include a dedicated fleet.
While the warehouse store unit economics are clearly strong, there is also the design studio, the RAMs, and their other commercial sales from Spartan. We don’t have disclosures to dive into each individually, but they should all be as good, if not better than the warehouse stores. The design studios are smaller and do not carry inventory, so any sales they generate has lower capital intensity (however, you could argue that the design studios need to be thought of in connection to the warehouses, since they support one another). The RAMs make $3mn+ each selling inventory and products that are already warehoused in the store or distribution center, with the only incremental cost being what they pay them. The hard spec commercial business (Spartan) is the hardest to get a grip on though. They have noted that “the commercial business is a lower gross margin business, but it’s a materially lower SG&A margin business”, so exactly how that shakes out is unclear. The commercial business offers pricing based on the specific customer, project, and amount ordered, so pricing here is very opaque. Some reps we spoke with thought we could get a discount of anywhere from 5-20%, but none of these were real quotes. If we assume a 10-15% pricing discount and SG&A of 10-15% of sales (versus an adjusted 26% for FND—the math is 20% at the store level for a mature warehouse and another 6% at the corporate level), that is a 10-20% operating margin business. Either way, it is definitely less capex-intensive and all incremental to Floor & Decor, so it should be ROIC accretive even if it does turn out to be margin dilutive.
We will now look at ROIC at a company-level briefly, before moving onto our revenue build and valuation.

ROIC.
Below we graph our ROIC analysis, which we calculate as owner earnings over invested capital. Our owner earnings calculation starts with operating income and adds back pre-opening expenses before applying interest expense and taxing it at a 20% rate. (We add back interest expense because they own some locations and distribution centers which are partially debt funded. If we didn’t, their earnings would look improved by swapping lease expenses for long-term interest-bearing debt, which isn’t captured in NOPAT—the typical numerator in an ROIC calculation. The technically correct treatment would be to only add back interest associated with purchasing those properties, but lack of disclosure and given that the total dollars are inconsequential, we don’t attempt to make this adjustment). It is also worth noting that our invested capital figure includes operating leases (with lease payments capitalized at 7x prior to accounting changes that required it be explicitly itemized as a liability on the balance sheet).

You can see that their current ROIC is just 11% over the past two years. However, this is because they still have a large portion of their store base that is new and ramping up. As stores mature and volumes increase, not only do their sales grow, but they enjoy operating leverage with margin expansion (over 10 points of margin expansion at the store level). So as their stores age, revenues will grow and they will become more profitable without requiring any meaningful incremental capex. Supporting this idea is the fact that their ROIC has increased ~4 points in the past 5 years as their portion of “aged” stores increases.
To estimate what the stores’ true underlying economics are, we show a “theoretical mature store ROIC” which assumes the average store generates just $24mn (under the $28mn they quoted a mature 5+ year old store making) and operates at a 15% EBIT margin with everything else held constant. This rough math shows that when the stores age, FND will be making closer to a ~20% company-wide return on their capital. (The dip in 2021 to 19% can be partially attributed to them increasing inventory ahead of store builds and because of supply chain issues, which bloats the invested capital base).
These figures show that just from their core warehouse store format, they should be able to generate 20% ROIC at maturity before taking action to improve their working capital position through better distribution center utilization or improving supplier payment terms. (Given that part of their core value prop is always having in-stock selection, they will always have high inventory levels and thus lower inventory turns). This is also before accounting for the RAMs, Spartan, or design studios, all of which should increase ROIC further.

Management and Incentives.
A lot of the current management team has been at Floor & Decor since they were private. As mentioned in the intro, CEO Thomas Taylor has been at the company since 2012. Virtually all of our channel checks and employee conversations expressed positive opinions about him and his management style. He doesn’t have any attitude that he is “too important” to be spending his time walking through stores and checking in with employees. People have described him as down to earth, which makes sense given his starting point at Home Depot at the lowest rung when he was 16.

CFO Trevor Lang joined the company in 2011 as Senior Vice President and CFO. In 2014, he also assumed the role of leading the Pro and Commercial business. With Lisa Laube leaving, he assumed the role of Executive Vice President while remaining CFO. The Pro initiatives have been very successful with 40% of revenues now coming from this segment. Several pros we spoke to had high opinions of Floor & Decor and how they are treated with many new initiatives like the loyalty program, mobile app, and their efforts to greatly decrease the time it takes for a Pro to get in and out of a store all occurring under Trevor Lang’s tenor. On the commercial side though, we heard from some sources that they thought he was unrealistically optimistic about their efforts there. It is still early innings though, so we will have to wait and see whether their goals are too optimistic. Prior to joining Floor & Décor, he was CFO of Zumiez (a clothing store chain) and served in various finance roles at Carter’s Inc (children’s apparel stores) and Blockbuster. He started his career as an auditor at Arthur Andersen.

Lastly, as mentioned in the intro, Lisa Laube recently stepped down as VP of Merchandising to be replaced by Ersan Sayman. We are calling out this position since Lisa Laube was critical in FND navigating the Chinese Tariffs, where they had ~30% of their products sourced from. She was able to quickly diversify their supply chain out of China to avoid much of the 25% product tax. As having in-stock inventory is a critical piece of FND’s value prop and given their need to stay competitive on pricing, this position is very important. Ersan Sayman actually joined the company very early, in 2003, and was most recently the VP of Merchandising under Lisa Laube, which gives us confidence that their strong record on inventory procurement can be maintained. The rest of the upper management team has also been there since at least 2013.

Now moving onto incentives, pay has 3 main components: 1) base salary, 2) annual cash incentive, and 3) stock incentives, with the latter two categories being variable. Their annual incentive bonus is 20% based off of revenue targets and 80% based off of operating income. Looking at 2020 and 2021, it seems like their revenue goals are not low bars, requiring an average of ~23% y/y revenue growth to meet that requirement. In fact, they actually only met 96% of their revenue target in 2020. The operating income metric also seems fair, requiring 7.8% for 2020, which was in-line with 2019’s operating margin. For 2020, the target operating margin metric was 8.6%, which they only handily beat because of monstrous Covid and stimulus-driven growth, but still required some margin expansion from the prior year. They also grant RSUs (restricted stock units) based on service requirements, in line with normal corporate practices, and PSUs (performance stock units).
Their PSU’s requirements also seem like they are set at a fair level. While their adjusted EBIT formula has a lot of stipulations, at a high level, if we take the middle bracket of $607 – $686mn, they need to grow sales at a ~20% CAGR with an 11% operating margin to hit it the 100%. This is about what our high-level model showed. Doing better than that would allow them to earn up to 200% of the target # of PSUs. Additionally, we like that there is a second stipulation that they also keep a minimum ROIC of 17% in each period in order to be eligible for any amount of the award (the specifics of how they calculate that ROIC is hard to unpack, but recall from our ROIC discussion that we currently had ROIC at 11%, so this doesn’t seem like a trivial target. However, they are using adjusted EBIT in the numerator).

Generally speaking, we have no issues with their pay practices, and they seem to have the right sentiment towards pay, as shown in the excerpt below.

Pay incentives aside, management seems very motivated (internally) to hit their long-term goals. We will now move on to our last big section: Valuation.

Valuation.
We used two methods to look at FND’s valuation. The first adds our NOPAT build of the stores to the RAMs build and then sensitize around reasonable multiples. The second methodology is a reverse DCF that shows the implied returned based off of our base assumptions.
Starting with the store NOPAT build, below is NOPAT under a 400-store and a 500-store scenario. We sensitized around revenue per store of $24-34mn as well as operating margins from 12-16%. Management is currently guiding their model in the long-term to $30mn per store with an operating margin slightly below 15%. At their old store forecast of 400, they would be estimated to earn $1.3 -1.4bn in NOPAT, which increases $400mn to $1.7-1.8bn under the 500-store scenario.

The next source of revenue we explicitly build out is from commercial reps. This would include the RAMs and the Spartan sales reps. It’s slightly confusing to break out the RAMs separately from the store revenue as the RAMs’ revenues are included in store sales (explicitly for SSS comp purposes), but the Spartan segment is not. However, management has put out an explicit long-term goal of $1.5bn in commercial sales and has noted on a recent earnings call that having 300-500 commercial reps each doing $3-5mn would be the goal. (It is not entirely clear if they were just referring to Spartan commercial reps or RAMs as well). We just took these two businesses together as the commercial opportunity and sensitized around revenue per rep and # of reps.
In our analysis, we assumed a 15% operating margin since (as mentioned) we don’t have a strong basis to say otherwise. This business should have far less SG&A with opex mostly consisting of the sales force salary and commissions. However, they could offer discounts on larger orders, reducing gross margins. We do not have adequate disclosure to estimate the net of this, but we believe discounts are far less common with the RAMs than with the Spartan commercial business who bids to win projects. Earlier, we estimated that commercial could be 10-20%, but we just show the midpoint of that below. It is not known how much the RAMs contribute today, but the Spartan business was around ~2% of revenues last year.

Our NOPAT build shows a total potential contribution to earnings of $110-300mn. While both of our NOPAT builds look similar, it is important to note that FND’s store model is much more proven than the commercial opportunity. While the commercial business makes sense, perhaps the addressable market is better served than they are assuming. The same way FND took their store estimates up from 400 to 500 after better understanding the retail flooring market, there is a risk that they take their commercial assumptions down after more experience here. (Our channel checks and industry experts were very positive on their store model but expressed trepidation at the commercial opportunity and thought FND could be too positive on it given that many are happy with Shaw and Mohawk—large wholesale distributors. The extent to which this skepticism applies to the RAMs too is not totally clear. Thus, we would consider the commercial earnings estimates lower confidence than our store earnings estimates and thus would be inclined to assume the lower bound of the NOPAT range.
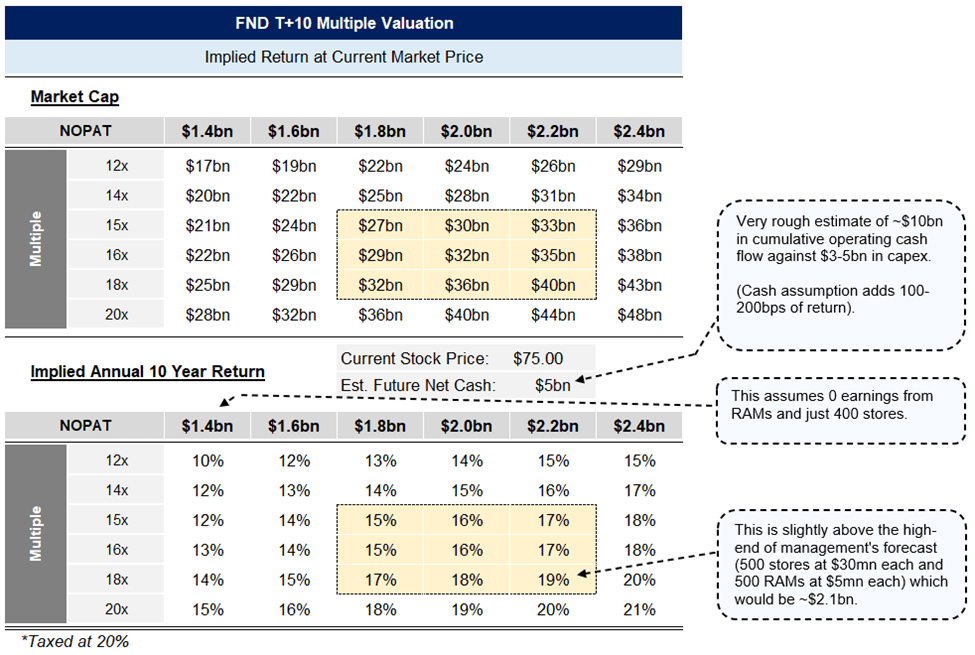
Below, we apply a range of multiples to a NOPAT range of $1.4bn to $2.4bn. These figures are a range of earnings estimates for 10 years out, after they have finished their period of high store growth. What multiple is the “right” multiple will depend on their growth prospects and whether they have the ability to continue to invest capital at such high ROICs thereafter. At a 12x multiple, an investor is assuming they are ex-growth and have limited to zero ability to reinvest subsequent capital. A slightly higher 14-18x multiple would assume they will continue to grow earnings at at least mid-single-digits. If you recall, mature stores still grow mid-single-digits, which is about in-line with the flooring market. A 20x (or higher multiple) would assume they have a longer-growth runway, either through opening stores in new geographies, improving SSS, or materially improving profitability. As you can see though, at today’s market price of $8bn, you do not need herculean assumptions to get a mid-to-high-teens return.
This is just one way to think about the valuation. The other methodology we employed was a reverse DCF. This method forces us to make explicit assumptions on the life of the company. But in contrast to a DCF, which gives latitude to pick the “right” discount rate, we like that a reverse DCF shows us what today’s implied return is based on today’s market price and our assumptions.
We choose to vary our results with how quickly their average sales per store grows in 10 years and for three different revenue growth scenarios after year 10. On the horizontal axis is two scenarios for FND reaching average revenue per store of $25mn in year 10 and a second scenario for $30mn. We assume they reach their 500 stores in 8 years. Future stores could either ramp up quicker than prior cohorts (as we’ve seen the past few years) or could break this trend by ramping up slower. This could especially be the case with more stores being placed in existing markets, cannibalizing existing stores sales for the first 1-2 years.
The vertical column in the table below sensitizes for 3 different growth scenarios. The low growth scenario assumes just 3% growth in year 11 which falls to 2%. The moderate growth scenario assumes 5% growth before falling to 2% in year 20. The high growth scenario assumes 6% growth that fades to just 3% in year 30 and is held at 3% thereafter. Frankly, even the “high growth” scenario doesn’t have very ambitious assumptions. We do not explicitly show commercial sales below for simplicity, but in our “moderate growth” scenario we assume they reach ~$1.5bn in commercial revenues in 10 years with the lower growth scenario cutting that by about 30-40% and the high growth scenario increasing that by about 25%. Across the entire range of estimates, commercial is only worth about 10-15% to the estimated intrinsic value.

As you see above, our reverse DCF gets us a 14-16% market-implied discount rate with Floor & Decor ramping up all 500 stores to $30mn in the 10-year period worth about 100bps of return and maintaining higher growth thereafter worth ~150bps. Of course, we are only varying our analysis with relatively few variables and the potential range of outcomes is much larger. However, we still think this gives an investor a good sense of outcomes (call it ~2 standard deviations).
The biggest risk our valuation analysis does not draw into question is whether they hit a wall with store openings very soon. Perhaps management misunderstood the market and 250 is the limit instead of 400 or 500. Even under such a bearish scenario, with 250 stores generating just their current average of ~$22mn each and just a 15x multiple, FND is worth ~$10bn. While you certainly need strong unit growth for FND to reach the valuation bands shown above, even in a fairly draconian scenario it is hard to see how FND isn’t worth at least a little more than today—so long as their core value prop is intact. However, there are still several other notable risks to the investment thesis, which we detail below.

Risks.
1) Delivery Advancements. One of biggest risks to Floor & Decor is if competition retools or technology enables competitors to offer in-stock selection without the inventory having to sit at the actual store. It seems unlikely that Home Depot and Lowe’s are going to reconfigure their whole stores to better compete in the hard flooring category (as Lowe’s even abandoned plans to make even more modest changes), but they could close the value prop gap by improving inventory delivery speeds. Home Depot is building out their bulk distribution centers that carry a lot of inventory that can be sent to a store quickly. If they are able to get speeds to one-day delivery or same-day, then it would present a very formidable threat to FND’s core value prop of having the most in-stock inventory. The more far-out risk is technological advancements in logistics, whether that be drones or autonomous vehicles being a game changer in delivery speeds over time. Although it’s hard to imagine drones being utilized for bulk items, who knows what the future brings. However, anything short of competitors getting same-day (maybe 1-day delivery) preserves a unique aspect of FND’s value prop.
2) Consumer Service Degrades. Our store checks showed a mixed customer experience, which we saw was mirrored by many customers’ recent reviews on Google. We saw many 1 and 2 star reviews, particularly over the last year, that complained about inattentive staff that seemed to be going out of their way not to help. While other retailers seem to have also taken a hit on customer service and stores in some states fared better than others, it still isn’t confidence-instilling to see customers complain so passionately about how much they hated their Floor & Decor experience. Generally though, most of their reviews are 4 stars or better. We think these employee issues have to do with larger issues pertaining to labor shortages, but nevertheless FND will suffer all the same if it is prolonged.
2) Supplier Materials Toxic. There is always a risk when buying materials that are industrial-produced in chemical-intensive processes that a substance used in that material turns out to be toxic. This is especially the case as they innovate on the flooring form factor, using new chemicals in their products. Similar to how asbestos turned out to be cancerous after a long period where people generally assumed it was benign, perhaps a chemical that lays in FND’s flooring is a toxin that has yet to be unearthed. If so, this would cause major class action lawsuits, recalls of product, and materially impact demand. Competitors would likely be in a similar boat, but that would be a cold comfort.
3) Market Saturation. The entire Floor & Decor thesis is predicated on future growth and the health of the hard surface flooring market. Should consumers no longer prefer hard flooring to the same extent, Floor & Decor will be one of the best specialty retailers selling something a shrinking number of people want. While we think it is unlikely, perhaps new forms of carpet or design trends make hard surface flooring less desirable. If the market for flooring contracts, it is unlikely that FND will be able to grow their store footprint to their goals and its existing stores could suffer shrinking sales. Any successful investment in FND is predicated on future growth, as they currently trade at ~28x 2021 earnings (at a $75 stock price) and if the TAM is smaller than we currently assume and we see SSS start to shrink, there could be capital impairment.
4) Copy-Cat Retailer. While we haven’t seen anything yet, the attractive market and unit economics could attract a copy-cat competitor who copies Floor & Decor’s model (similar to Sam’s Club modeling their stores after Price Club—Price Club merged with Costco in 1993). Having a second specialty retailer with warehouse format stores would erode Floor & Decor’s unique value prop and shrink their potential growth runway. Of course though, setting up a competitor would not be easy and they would likely have problems sourcing materials at the same prices starting with zero volumes.
5) Tariffs. Floor & Decor had to navigate the Chinese tariffs in 2017 by moving their supplier base and cutting down on Chinese suppliers, but perhaps a more onerous tariff could be enacted that surcharges all non-US made flooring. This seems unlikely as there is no impetus for it currently and they have already moved most of their suppliers out of China.
6) Branded or Flooring Innovation. Perhaps a popular flooring brand could be created, or a popular existing brand could move into flooring, where customers demand that specific product. Or perhaps a new sort of flooring is created that is much more environmentally friendly and FND does not have access to it through their existing suppliers. This could give the product more pricing power and bargaining leverage against their retailers which could potentially decrease margins.
7) Macro. In the short-term, a softer macro environment where consumers do not feel confident enough in their finances to make big purchases on flooring is a risk, but it will pass. Higher interest rates and slower home sales have not had much of an impact on FND historically as most flooring buyers are not new homeowners. However, we do not know how many buyers take out a home equity loan or finance their flooring purchase, in which case interest rates could have a direct impact. At a high level, in a recession, investors tend to shy away from nonessential, infrequently purchased durable goods companies as consumers could defer those purchases the easiest. This would only impact a couple years of earnings though, and thus by definition is an inconsequential portion of intrinsic value (however, admittedly it can be a “driver” of price in the short-term). The business risk from poor macro is a short to potentially intermediate-term risk.
Summary Model.
Below is FND’s short-term targets from their analyst day, which shows at least 20% revenue growth with some operating margin expansion coming through. Our model is partially informed by this as well as their store unit growth estimates we showed prior.

Below is our summary model of FND. We do not spend a lot of time honing estimates for a particular year because we generally ascribe to the point that nothing worth forecasting can be forecasted and anything that can be forecasted isn’t worth forecasting. Instead, the purpose of our models is so an investor can get a grip of high-level figures and see how different items flow through. Additionally, Members Plus subscribers can change assumptions and manipulate the model how they wish to see different potential earnings scenarios.


Conclusion.
Thank you for reading our Floor & Decor piece, we hoped you learned a lot! Be on the lookout for our FND PM Summary which will be released soon and will recap all the key points in this piece. If you have any comments, questions, or concerns please reach out to us at info@speedwellresearch.com.

*At the time of this writing, one or more contributors to this report has a position in Floor & Decor. Furthermore, accounts one or more contributors advise on may also have a position in Floor & Decor. This may change without notice.